High Energy Earth Science: Muon and Neutrino Radiography
- Article
- Open access
- Published:
A potential space- and power-effective muon sensor module for imaging a volcano
Earth, Planets and Space volume 62, pages 179–186 (2010)
Abstract
The application of muon radiography will be greatly enhanced by the use of two muon sensor modules that save electric power consumption and are easily transportable. Muon sensor modules used for a volcano observation must have a low electric power consumption requirement and be both waterproof and portable. In this article, we discuss two candidate sensor modules: (1) a portable muon sensor module with wavelength-shifting (WLS) fibers and a multi-anode photomultiplier tube (MAPMT), and (2) a regular scintillator telescope with PMT complemented by a low-power Cockcroft-Walton circuit (CWPMT). A realistic telescope system consisting of a muon sensor module with MAPMT has been tested and found to consume 76 W, most of which (72 W) is used by the redundant electronic circuit required for pulse shaping; this could be modified to drastically improve the power consumption. In comparison, a muon telescope system with a CWPMT was found to consume 7.57 W. We also calculated the muon stopping length in SiO2 by means of a Monte-Carlo simulation. This calculation provided the average density structure along the muon path in rock, where the muon path length was shorter than 1.5 km, with an accuracy of about 5% during a 90-day measurement period by assuming a 1-m2 muon detector with an angular resolution of 25 mrad.
1. Introduction
For a number of years, researchers have been attempting to image volcanoes (e.g., Tanaka et al., 2003, 2005, 2007a, b, 2008; Tanaka and Yokoyama, 2008), pyramids (e.g., King et al., 1999), and contrabands (e.g., Borozdin et al., 2003) radiographically using cosmic-ray muons. Tanaka et al. recently succeeded in visualizing the internal density distribution of volcanoes using this technique, with an accuracy in terms spatial resolution that is superior to that possible using conventional geophysical techniques. Observations of volcanoes are challenging because (1) the amount of battery power that can be transported to the system is limited, (2) housing for the telescope system is necessary due to environmental conditions, and (3) the remote and often difficult terrain leading to the observation points require that the unit be easily transportable. These issues were particularly important for the observations performed at Mt. West Iwate and Mt. Asama. Previous observations were performed at a long distance from these volcanoes due to the cumbersome digital sensor system used and the high electrical power requirement of the system. Tanaka et al. overcame these difficulties by using nuclear emulsion photographic films. These films are light and do not require electrical power. Employing this technology, Tanaka et al. obtained radiographic images of the interior density structure of the Mt. Asama (Tanaka et al., 2007a, b, 2008) and Mt. Usu (Tanaka and Yokoyama, 2008) volcanoes with high angular resolution and accuracy. Images with such a high resolution can not be achieved using a conventional geophysical method. The use of nuclear emulsion photographic films for muon observation at volcano was originally impractical due to the numerous particle tracks that had to be read manually. Nakamura et al. (2006) developed an automatic particle track reading machine to facilitate this procedure. The machine had been used in conjunction with the OPERA experiment (Guler et al., 2000) to look at neutrino oscillations and shown to be employable. However, the machine does not enable the interior structure of volcanoes to be observed in real time since the emulsions require analog photographic development. To interpret the dynamics of the volcanic explosion, it is necessary to be able to interpret the variation in the interior density structure of volcanoes over time. For this purpose, we have proposed a new muon sensor system which is lightweight and requires less electrical power. This system was developed and used in 2008 for the first time at Mt. Satsuma-iwojima and Mt. Sakurajima (Tanaka et al., 2010). The use of the MAPMT (multi-anode photomultiplier tube) enables the number of PMTs in the system to be reduced and, in addition, the system can be more compact since the counter does not require to be separated into parts. We have also succeeded in developing a new PMT which runs at a lower voltage. As such, the high voltage (HV) supplier can be removed in the field, enabling the full system to be simplified. For this application, we propose that two different types of muon modules be used.
2. Experimental
2.1 Detector design
2.1.1 Muon sensor module with MAPMT
Our tracking system comprises two modules that can make a two-dimensional (2-D) measurement of the track intersect. Originally, we considered three candidate systems: (1) a gas chamber, (2) a detector consisting of PMTs at the four corners of a plastic scintillator that would measure the arrival time from the vertex point of a cosmic ray muon, and (3) a cross-aligned plastic scintillator array to determine the vertex point by determining the coincidence of two signals from two scintillators. However, methods (1) and (2) were associated with the following problems. A gas chamber utilizes gas, and a steady gas supply is cumbersome if not difficult at a volcano site. Moreover, the transportation of any system to the observation point is usually difficult, so a wire chamber is not ideal since it is sensitive to vibration. In terms of candidate detector (2), a method of arranging PMTs at four corners of a plastic scintillator leads to a time dependence on the positional accuracy due to the gain drift of the PMTs. Since this method uses the signal height of the PMT as the trigger for timing, the position is influenced by the surrounding temperature changes at the volcano site. For these reasons, we developed a module utilizing a crossaligned plastic scintillator array, i.e. the third candidate detector system. To avoid a large number of PMTs, MAPMTs are used. In a MAPMT, PMTs are combined so that signals can be treated collectively. Furthermore since the module does not need to be separated into units, its construction is more robust and better suited for an outdoor environment. The size of each plastic scintillator is 40 cm (L) × 3.4 cm (W) × 2 cm (H). The plane contains 12 plastic scintillators arranged along the x and y coordinates like a lattice; it consists of 144 coincident elements, and its root mean square (RMS) error of point resolution is ΔX = ±1.0 cm, ΔY = ±1.0 cm (Fig. 1(a)). The total area of the plane is 0.16 m2, and the unit weighs about 10 kg. A slot (2 mm in depth and 2 mm in width) in the plastic scintillator contains a wavelength-shifting (WLS) fiber (Fig. 1(b)). This WLS fiber converts purple scintillation light (wavelength = 420 nm) into green light (wavelength = 500 nm). This WLS can transmit light without greatly attenuating it because there is a clad layer outside of the fiber as well as an optical fiber. The end of the fiber is held by a blackcolored holder; black silicon rubber is affixed between the fiber and the fiber holder to prevent light leakage. The fiber holder and the MAPMT (HAMAMATSU H8500) are fastened together with light shielding tape (Fig. 1(c)). The H8500 MAPMT has 64 anode pixels. While the quantum efficiency of the module is 24% for standard scintillation light (wavelength 420 nm), the quantum efficiency is 14% for light emitted from the WLS fiber (wavelength 500 nm). The quantum efficiency of light emitted by a WLS fiber is therefore 57% compared with the quantum efficiency of the usual scintillation light. The position of a passing muon is determined by taking measurements at the x and y coordinate signal output from the MAPMT module. The direction of a muon can be determined by combining two muon sensor planes and determining the hit position of a muon in each plane.

(a) Point-sensitive portable muon sensor module with MAPMT, (b) shift fiber filled in a 2-mm-diameter gutter, (c) shift fiber is connected to each anode pixel of the MAPMT with a fiber holder.
2.1.2 Muon sensor module with CWPMT
One weak point of the module consisting of an integrated combination of scintillators and MAPMT is that it is difficult to continue observations when one MAPMT breaks. One possible alternative approach is to develop PMTs that run at much lower electrical power. We therefore propose incorporating a PMT that can be used with Cockcroft-Walton circuitry (CWPMT). A new model of the module PMT (R7724) with the Cockcroft-Walton circuit has been developed in cooperation with Hamamatsu Photonics. The Cockcroft-Walton circuit is basically a voltage multiplier which converts a low voltage level to a high voltage level. It comprises a multiplier ladder network of capacitors and diodes to generate high voltage. One can obtain a voltage that is about 100-fold higher than the input voltage by constructing this high voltage generation circuit. This means that a high voltage becomes possible without the need of bringing a HV power supply to the field. Thus, one can simplify the system and increase safety at the same time. The point-sensitive muon sensor system with CWPMT is shown in Fig. 2. A plastic scintillator (100 cm (L) × 7 cm (W) × 2 cm (H)) is connected to an Acrylic light guide which is in turn connected to a PMT. The system is designed to exploit the total reflection of light via the Acrylic light guide. Scintillation light generated in the plastic scintillator is efficiently transmitted to the PMT by this method. The weight of one module (one plastic scintillator + one light guide + one PMT) is 3.4 kg.

Point-sensitive muon sensor with CWPMT.
One plane contains 12 plastic scintillators arranged in the x and y coordinates and has 144 coincidence elements; its RMS error of point resolution is ΔX = ±2.0 cm, ΔY = ±2.0 cm (Fig. 2). The arrival direction of a muon can be determined by combining two muon sensor planes, and determining the position of a muon in each plane.
2.2 Assembly testing
We performed a cosmic-ray muon test observation using the proposed modules. The purpose of the test experiment was to confirm that the two described modules can be used for muon observation. With this goal, we measured the zenith angle distribution of the cosmic-ray muons using each of the two modules and compared the experimental result to the DEIS experiment result (Allkofer et al., 1981). In the DEIS experiment, cosmic-ray muon momentum and charge ratio were measured with the DEIS spectrometer. The experiment was performed according to the following procedures.
-
(1)
We observed the analog output signal of each channel of MAPMT and that of CWPMT with the oscilloscope, measured the distribution of pulse height, and optimized the discrimination level.
-
(2)
The zenith angle distribution of the cosmic-ray muons measured by each of the new modules proposed in this paper were compared. The experiment using the following procedures. The analog signal output from each PMT channel was the input to a discriminator (KAIZU WORKS KN1300). As a result, the signal changed into a digital signal with the width of a 20- ns pulse and a NIM level. The coincidence of these two signals was taken (TECHNOLAND CORP N-TM 103). Finally, the output was processed by a visual scaler (TECHNOLAND CORP N-OR 425) and calculated as a 1-D histogram.
-
(3)
The zenith angle distribution of cosmic-ray muons was measured as a coincidence of the two planes with MAPMT. The electrical block diagram used in this experiment is shown in Fig. 3. In this experiment, a multiplicity cut (see Tanaka et al., 2001) is used, which means that when there is more than one hit in any of the four planes of the scintillators, the events are discarded. The result of this measurement was assessed along with the result of the DEIS experiment. By evaluating the results of (2) and (3) with the multiplicity cut, we confirmed that a large number of the soft components were removed using a multiplicity cut.
-
(4)
We measured total electric power consumption of these two muon sensor systems by using power meter (HIOKI 3334 AC/DC POWER HITESTER).

Electrical block diagram used at the experiment. Signals from #A1 to #D12 are analyzed in the PC, where the difference between the number of #A and #C corresponds to the vertical angle (θ), and the difference between the number of #B and #C corresponds to the horizontal angle (ϕ).
2.3 Result
The results of the experiment are as follows.
-
(1)
The photographs of the pulse distribution output from the MAPMT, CWPMT, and R7724 systems are shown in Fig. 4.

Pulse outputs from MAPMT (a), CWPMT (b), and R7724 (c).
The distribution of the peak of pulse height output from each channel of MAPMT is shown in Fig. 5. When MAPMT was supplied 870 V of electrical power, the typical peak of pulse height output from MAPMT was 80 mV, and the pulse width was 2 ns. When the CWPMT was supplied with 5 V of electrical power, the peak of pulse height output from the CWPMT was 1.8 V, and the pulse width was 15 ns. As a result, the signal from the CWPMT is easier to discriminate than that from the MAPMT. Based on the result of the distribution of the pulse height, we determined the discrimination level to be 25 mV for MAPMT and 80 mV for CWPMT.

Distribution of pulse height outputted from each channel of two muon sensor modules with MAPMT.
-
(2)
The muon intensity was measured using the two muon sensor planes proposed in this paper as a function of vertical angles (Fig. 6(b)). The measured muon intensity was adjusted so that the intensity at θ = 90° corresponded to that from the DEIS result.
-
(3)
The muon spectrum measured with MAPMT is shown in Fig. 6(a). Figure 6(b) shows the 2-D histogram resulting from the observation. In this experiment, we used the comparator developed by Uchida et al. (2010); however, the pulse width is so short that the comparator was unable to discriminate the signal. To solve this issue, we placed a discriminator (KAIZU WORKS KN1300) between the modules and the comparator.
-
(4)
We confirmed that the total power consumption of the muon sensor system with the MAPMT was 76 W, with the discriminator consuming 72 W of electrical power. We confirmed that the DC power supply consumed 3.25 W and that the CWPMT consumed 0.09 W when the CWPMT was supplied with 5 V of electrical power. Thus, the total power consumption of the muon sensor system with the CWPMT was 0.09 × 48 + 3.25 = 7.57 W.

(a) ○ shows the muon intensity with MAPMT, × shows the muon intensity with CWPMT, ◊ shows the intensity flux with multiplicity cut. The measured muon intensities are adjusted so that the intensities at θ = 90° correspond to that from the DEIS result (□). (b) Detection efficiency of the muon sensor with MAPMT as a function of azimuth and zenith. The detection efficiency is a convolution of those from the zenith angular dependence of cosmic-ray muons and from the geometrical structure of the detector.
3. Discussion
The results of these experiments have provided valuable information on important properties of the proposed candidate muon sensor modules which will improve future investigations.
The properties of the muon sensor module with MAPMT are:
-
(1)
it is possible to make it waterproof due to its mechanical compact arrangement;
-
(2)
the module is easy to assemble due to a decreased number of MAPMT inside the system;
-
(3)
the unit price for each channel is less expensive than in earlier versions of the module. The high consumption of electrical power, 76 W, in this system is due to the use of a discriminator to lengthen the pulse width from the module. The present discriminator consumes 1.5 W/channel. In general, a high-speed amplifier and pulse shaper are not power effective, and their cost per channel is higher. We consider that one way to reduce the power consumption would be to employ a unit consisting of a fast comparator and a FPGA (field-programmable gate array) to modify the pulse height and the pulse width. We expect that the power required for the operation will be less than 100 mW/channel.
This module can potentially be miniaturized, is lightweight, and the unit price per channel is low. In addition, the modules can adapt to the constraints determined by the installation location. For example, we can potentially place the modules at several locations surrounding a volcano and produce 3-D radiographic images of the interior density structure of the volcanoes. One disadvantage of this approach is that if one MAPMT breaks, it is not possible to continue receiving data.
The muon sensor module using CWPMT combined with a Cockcroft-Walton circuit has the following advantages,
-
(1)
Since the PMTs are separated, even if one or more PMT breaks down, it is possible to continue making observations.
-
(2)
The HV supplier is built into the system, and the system is simplified.
It is necessary to determine the best distance between two modules if we wish to set up the modules proposed in this paper at a volcano. To this end, we calculated the scattering angle of the muon through an object (SiO2) using a Monte-Carlo simulation. This calculation enabled us to obtain the measurement of the angle resolution utilized in the image of the interior density structure of a volcano. We performed the simulation using the following procedures.
-
(1)
We fitted the muon spectrum from the DEIS experiment to the following formula (Matsuno et al., 1984).
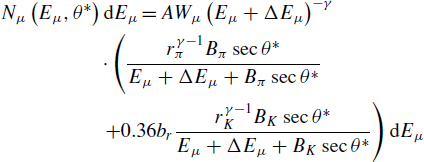 (1)
(1)where Wμ is the muon survival probability. The ratio of the muon momentum to the momentum of the parent pion (r π ) is 0.78, and the parent Kaon (r K ) has a ratio of 0.52. The decay length of the mesons that have an energy of B π = 90 GeV and B K = 442 GeV corresponds to the thickness of the atmospheric layer. The branching ratio of the K μ2 decay mode is b r = 0.635, and ΔE μ is the muon energy loss in the atmosphere from the top to sea level. The factor γ is the power index of the primary cosmic-ray spectrum. We determined the unknown parameters of A, γ , and ΔE μ by fitting the results of the DEIS experiment to the formula.
-
(2)
We generated random numbers, and using these numbers, we generated muons (θ = 80°) adapted to the energy distribution obtained by Eq. (1).
-
(3)
We injected the generated muons into SiO2 (ρ = 2 g/cm3) with a thickness of 500, 1000, and 1500 m, and calculated the physical process in SiO2. Physical processes in the material of the muon were calculated with GEANT4: a toolkit for simulating the passage of particles through matter (Agostinelli et al., 2003).
-
(4)
We calculated the change in the muon angle after they had passed through SiO2. The result of this simulation is shown in Fig. 7 as a 1-D histogram.


Distribution of muon scatter angle after passing through (a) 500 m SiO2, (b) 1,000 m SiO2, (c) 1,500 m SiO2, where the arrival angle of the muon is 80° and the density of SiO2 is 2 g/cm3.
As shown in Fig. 7, the averages of the muon scattering angle were 15, 13, and 12 mrad, and the RMS errors of the muon scattering angle were 26, 22, 20 mrad, respectively. The energy spectrum of cosmic-ray muons obeys a power low. The mean energy of the muon that penetrates through a thin material is low; in contrast, the mean energy of the muon that penetrates through a thicker material is higher. Therefore, the scattering angle of muons becomes larger when the material becomes thinner. We calculated the muon scattering angle for θ = 70° and θ = 75° and found that these results were almost the same as that for θ = 80°. As a result, the distance between planes with MAPMT should be 2.2 m or less, and the distance between modules with CWPMT should be 4.7 m or less. The distance of 2.2 and 4.7 m corresponds to maximum angular errors of about 15 mrad, which is the typical scattering angles of muons after passing through the rock. Increasing the distance would only decrease the statistics of detected muons. We next examined the potential of these modules to produce an image of the interior structure of the Sakurajima volcano using a Monte-Carlo simulation. In these calculations, we assumed that the muon sensor would be installed at the point shown in Fig. 9(a) where electricity is available. Under this assumption, the following procedures were performed.

Stopping distribution of incident muons at arriving angle of θ = 80° with energy above (a) 10 GeV, (b) 100 GeV, (c) 1 TeV.

(a) Topographic map of Mt. Sakurajima, (b) Cross-section diagram of Mt. Sakurajima, and (c) radiographic image of Mt. Sakurajima obtained from a Monte-Carlo simulation where the plastic scintillator size is 1 m2 and the measurement period is 90 days.
-
(1)
3-D information from the topographical map (with a scale of 1 to 25000 provided by Geographical Survey Institute) and the result measured by airborne laser scanner (Fig. 9(b)) (Sasaki et al., 2003) were used to obtain a 2-D map, including the path length in the direction of θ and φ, as seen from the muon sensor.
-
(2)
By generating random numbers, we generated a muon spectrum according to the energy distribution obtained by Eq. (1).
-
(3)
The stopping length of the muons in SiO2 was calculated using Geant4, and a table was constructed to represent the data. For example, the stopping distribution of incident muons at an arrival angle of θ = 80° with energy above 10 GeV, 100 GeV, and 1 TeV is shown in Fig. 8.
-
(4)
By using the result of (2) and (3), we calculated the number of detected muons during a 90-day measurement period by assuming a 1-m2 muon detector with an angular resolution of 25 mrad. The result is shown in Fig. 9(c).
As shown in Fig. 9(c), we can determine the average density structure along the muon path in Mt. Sakurajima, where the muon path length is shorter than 1.5 km (550 m below the summit of Sakurajima), with an accuracy of about 5% during a 90-day measurement period. This value was determined using the simulation result at a confidence level of 1σ. This 90-day measurement period is not long compared with the time scale of volcanic activity. An accuracy of 5% is enough to observe ascending magma in a 100-m conduit in rock with a thickness of 1.6 km.
4. Conclusion
We confirmed that the total power consumption of the muon sensor system with MAPMT is about 76 W and that of the muon sensor system with CWPMT is about 7.57 W. The Monte-Carlo simulations using GEANT4 revealed that the limit of the angular resolution is about 15 mrad. We also confirmed that we can determine the average density structure along the muon path in Mt. Sakurajima where the muon path length is shorter than 1.5 km (550 m below the summit of Sakurajima) with an accuracy of about 5% during a 90-day trial, assuming a 1-m2 muon detector with an angular resolution of 25 mrad.
References
Agostinelli, S., J. Allison, K. Amako, J. Apostolakis, H. Araujo, P. Arce, M. Asai, D. Axen, S. Banerjee, G. Barrand et al., GEANT4—a simulation toolkit, Nucl. Inst. Methods A., 506, 250–303, 2003.
Alkofer, O. C., K. Carstensen, G. Bella, W. D. Dau, H. Jokisch, G. Klemke, Y. Oren, and R. C. Uhr, Proc. of 17th Cosmic Ray Conf., 10, 321–324, 1981.
Borozdin, K., G. Hogan, C. Morris, W. Priedhorsky, A. Saunders, L. Schultz, and M. Teasdale, Radiographic image with cosmic-ray muons, Nature, 422, 277, 2003.
Guler, M. et al., OPERA Collaboration, Experiment proposal, CERNSPSC- 2000-028, CERN-SPSC-P-318, LNGS-P25-00, July 10, 2000.
King, N. S. P., E. Ables, K. Adams, K. R. Alrick, J. F. Amann, S. Balzar, P. D. Barnes, M. L. Crow, S. B. Cushing, J. C. Eddleman et al., An 800- MeV proton radiography facility for dynamic experiments, Nucl. Instr. Methods A, 424, 84–91, 1999.
Matsuno, S., F. Kajino, Y. Kawashima, T. Kitamura, K. Mitsui, Y. Muraki, Y. Ohashi, A. Okada, and T. Suda, Cosmic-ray muon spectrum up to 20 TeV at 89° zenith angle, Phys. Rev. D, 29, 1–23, 1984.
Nakamura, T., A. Ariga, T. Ban, T. Fukuda, T. Fukuda, T. Fujioka, T. Furukawa, K. Hamada, H. Hayashi, S. Hiramatsu et al., The OPERA film: New nuclear emulsion for large-scale, high-precision experiments, Nucl. Instr. Methods A, 556, 80–86, 2006.
Sasaki, H., S. Mukoyama, C. Inaba, and M. Oda, Measurement of the southern active crater of Sakurajima volcano by airborne laser scanner, Programme and abstracts the Volcanological Society of Japan, 2003, 174, 2003.
Tanaka, H. K. M. and I. Yokoyama, Muon radiography and deformation analysis of the lava dome formed by the 1944 eruption of Usu, Hokkaido: Contact between high-energy physics and volcano physics, Proc. Jpn. Acd., Ser B, 84, 107–116, 2008.
Tanaka, H. K. M., K. Nagamine, N. Kawamura, S. N. Nakamura, K. Ishida, and K. Shimomura, Development of the cosmic-ray muon detection system for probing internal-structure of a volcano, Hyperfine Interact., 138, 521–526, 2001.
Tanaka, H., K. Nagamine, N. Kwamura, S. N. Nakamura, K. Ishida, and K. Shimomura, Development of a two-fold segmented detection system for near horizontally cosmic-ray muons to probe the internal structure of a volcano, Nucl. Instr. Methods A, 507, 657–669, 2003.
Tanaka, H. K. M., K. Nagamine, S. N. Nakamura, and K. Ishida, Radiographic measurements of the internal structure of Mt. West Iwate with near-horizontal cosmic-ray muons and future developments, Nucl. Instr. Methods A, 555, 164–172, 2005.
Tanaka, H. K. M., T. Nakano, S. Takahashi, J. Yoshida, and K. Niwa, Development of an emulsion imaging system for cosmic-ray muon radiography to explore the internal structure of a volcano, Mt. Asam, Nucl. Instr. Methods A, 575, 489–497, 2007a.
Tanaka, H. K. M., T. Nakano, S. Takahashi, J. Yoshida, M. Takeo, J. Oikawa, T. Ohminato, Y. Aoki, E. Koyama, H. Tsuji, and K. Niwa, High resolution imaging in the inhomogeneous crust with cosmic-ray muon radiography: The density structure below the volcanic crater floor of Mt. Asama, Japan, Earth Planet. Sci. Lett., 263, 104–113, 2007b.
Tanaka, H. K. M., T. Nakano, S. Takahashi, J. Yoshida, M. Takeo, J. Oikawa, T. Ohminato, Y. Aoki, E. Koyama, H. Tsuji, H. Ohshima, T. Maekawa, H. Watanabe, and K. Niwa, Radiographic imaging below a volcanic crater floor with cosmic-ray muons, Am. J. Sci., 308, 843–850, 2008.
Tanaka, H. K. M., T. Uchida, M. Tanaka, H. Shinohara, and H. Taira, Development of a portable assembly-type cosmic-ray muon module for measuring the density structure of a column of magma, Earth Planets Space, 62, this issue, 119–129, 2010.
Uchida, T., H. K. M. Tanaka, and M. Tanaka, Development of a muon radiographic imaging electronic board system for a stable solar power operation, Earth Planets Space, 62, this issue, 167–172, 2010.
Author information
Authors and Affiliations
Corresponding author
Rights and permissions
Open Access This article is licensed under a Creative Commons Attribution 4.0 International License, which permits use, sharing, adaptation, distribution and reproduction in any medium or format, as long as you give appropriate credit to the original author(s) and the source, provide a link to the Creative Commons licence, and indicate if changes were made.
The images or other third party material in this article are included in the article’s Creative Commons licence, unless indicated otherwise in a credit line to the material. If material is not included in the article’s Creative Commons licence and your intended use is not permitted by statutory regulation or exceeds the permitted use, you will need to obtain permission directly from the copyright holder.
To view a copy of this licence, visit https://creativecommons.org/licenses/by/4.0/.
About this article
Cite this article
Taira, H., Tanaka, H.K.M. A potential space- and power-effective muon sensor module for imaging a volcano. Earth Planet Sp 62, 179–186 (2010). https://doi.org/10.5047/eps.2009.06.005
Received:
Revised:
Accepted:
Published:
Issue Date:
DOI: https://doi.org/10.5047/eps.2009.06.005