International Reference Ionosphere (IRI) (II)
- Article
- Open access
- Published:
Annual and semi-annual Sq variations at 96° MM MAGDAS I and II stations in Africa
Earth, Planets and Space volume 64, pages 425–432 (2012)
Abstract
The quiet daily variations of the geomagnetic field (Sq) have been studied by using the geomagnetic data of the 10 International Quietest Days. Geomagnetic data from MAGDAS I and II stations—ten stations were selected around the 96° magnetic meridian (MM)—over Africa have been analyzed from September 2008 to August 2009. The analysis of this unique data set clarifies the characteristics of the Sq variations over the African sector for the first time by observational geomagnetic data. In this paper, we found that Sq(H) and Sq(D) show a predominantly annual variation. The most interesting result, and a new finding in the African sector, is the appearance of two vortices in the day lit southern hemisphere during spring. Further data analysis also revealed many other interesting characteristics for the Sq over the African sector.
1. Introduction
On days which are quiet with respect to solar terrestrial activity phenomena, the geomagnetic field variations are called solar quiet, or quiet daily, variations ‘Sq’ (Campbell, 1982). The system of horizontal electric currents in the ionosphere could produce this Sq field (Chapman and Bartels, 1940). It is considered that the Sq current system consists of four sets of vortices, two in each hemisphere; in both the northern or southern hemisphere, one vortex is situated in the dayside, while the other extends over the nightside. The dayside vortex represents the Sq equivalent current. The dayside or ‘Sq current’ vortex of the northern hemisphere is counter clock-wise, while the vortex of the southern hemisphere is clock-wise (Takeda, 2002).
The Sq field changes are caused by the dynamo effect of diurnal and semidiurnal tidal winds in the lower ionosphere around an altitude of 100 km, that are generated in situ by solar heating during the daylight hours (Matsushita, 1977). On the other hand, numerical simulation for Sq fields has shown that fluctuations in the neutral wind propagated below can cause significant day-to-day variations in Sq fields even though in-situ solar heating is in a steady state (Miyahara and Ooishi, 1997). The distribution of Sq mainly depends on the latitude and the local time (Chapman and Bartels, 1940).
The study of electric currents in the ionosphere is not easy because of the difficulty in making direct in situ measurements of these currents, which is why collecting data from ground-based magnetometers is so important. The magnetic field perturbations are usually resolved along a ge omagnetically north-south (positive north), east-west (positive east), and parallel to B, directions and are denoted as H, D, and Z components, respectively. Sometimes a geographic coordinate system is used, in which case the symbols X, Y, and Z denote the magnetic perturbations in the north, east, and vertical (positive down) directions. It is impossible to derive the true horizontal ionospheric current distribution uniquely from ground magnetic perturbations, since they are a superposition of contributions from the horizontal ionospheric currents, field-aligned currents, distant currents in the magnetosphere, and currents induced in the Earth’s surface. For these reasons, the ground magnetic perturbations are usually expressed in terms of ‘equivalent’ ionospheric currents.
It should be noted that determination of the datum level of the geomagnetic quiet daily variation is difficult because of a lack of knowledge of the electromagnetic state of the night-side ionosphere. However, some researchers (e.g. Matsushita and Maeda, 1965) assumed that the zero level is the daily mean of Sq field variations, allowing for some amount of night-side Sq currents. Other researchers (e.g. Matsushita, 1967) preferred to use the mean of nocturnal values as the zero level. In that case, a derived Sq current system exists only in the day-side hemisphere. In-situ observations of the Sq current by rocket measurements did not produce evidence supporting the existence of a night-side Sq current system (Onwumechili, 1992).
The Sq variations were studied all over the world by using observational data in the sectors of the world that have stations, but the African sector was studied only by using the simulation results, because of the absence of a magnetometer array covering the African sector. In 2008, MAGnetic Data Acquisition System (MAGDAS) magnetometers were installed over Africa (Yumoto et al., 2009), and (Yumoto et al., 2010), which has enabled the study of the Sq over Africa. In the present paper, by using this unique data set, Sq variations over the African sector will be discussed for the first time as observational results. The geomagnetic quiet interval from September 2008 to August 2009 has been analyzed by using this data set, and the annual and semiannual Sq variations and other features have been studied.
2. The Data and Analysis Method
The data set analyzed in this study was obtained from ten ground-based magnetometer stations in Africa along the 96° MM [magnetic meridian] longitudinal sector. The stations are L’aquila (LAQ, G.M.Lat = 36.25°, G.M.Lon = 87.56°); Fayum (FYM, 25.76°, 112.65°); Aswan (ASW, 15.20°, 104.24°); Khartoum (KRT, 5.69°, 103.8°); Nairobi (NAB, –10.65°, 108.18°); Dalelsalam (DES, –16.26°, 110.59°); Lusaka (LSK, –26.06°, 98.32°); Maputo (MPT, –35.98°, 99.1°); Durban (DRB, –39.21°, 96.1°); Hermanus (HER, –42.29°, 82.20°). Further information about the stations is available at the website of the MAGDAS/CPMN project http://www.serc.kyushu-u.ac.jp/index_e.html. The coordinates of the stations used in this study are listed in Table 1 and their corresponding locations on the world map are shown in Fig. 1. The stations are arranged in Table 1 according to their latitudes. The data for solar quiet days were selected according to the 10 International Quietest Days per month from the German Research Center for Geosciences (GFZ): http://www-app3.gfz-potsdam.de/kp_index/qddescription.html.

A station map of MAGDAS stations used in the study.
In this paper, we have analyzed only the H and D components of the geomagnetic field. The daily variation of the H component at each station can be represented by a Fourier series as follows:

where a m and b m are Fourier coefficients which are calculated by using a least-square fitting. T is equal to 24, which is the total number of hours per day. t is the sample time (local time). Δ represents the deviation of the geomagnetic field from the baseline. The baseline was calculated in this paper as the average value for the night-time hours from 2300 LT to 0300 LT for each station, as we assumed that there is no night time current. Similarly, the daily variation of the D component, ΔD(t) was represented by a Fourier series. We analyzed the mean hourly values of all-day solar daily variations of Sq (H) by using Eq. (1) as a function of local time, and Fourier coefficients with order m = 0–4. The daily variations of Sq (D) were analyzed by a similar method. The longitudinal (i.e., local time) variations can be described by a Fourier analysis from Eq. (1), while the latitudinal distribution of ΔH and ΔD can be estimated by fitting Legendre polynomials with degree n = 0–6 for each local time (t). The magnetic field vectors derived from the magnetometer data of each station were rotated clockwise through 90° to indicate a current flow direction so that the equivalent current system of the Sq could be plotted as a function of local time and latitude. The stations used in this paper are located between geomagnetic latitudes from 36°N to 42°S. The data were divided into four seasonal groups: Fall includes the months from September to November; S-Summer from December to February; Spring from March to May; and N-Summer from June to August.
3. Results of the Data Analysis
In this paper, the results will represent the characteristics of the solar quiet geomagnetic variations in the African sector and the seasonal, semi-annual and annual variations of the equivalent Sq current system. Our observational results show that:
-
(1)
Figure 2 shows the Sq equivalent current system plotted for a one-year average of the magnetic field data from September 2008 till August 2009. In this figure, there is asymmetry in shape between the northern vortex and the southern vortex of the current system. An asymmetry in intensity was also found in the yearly average of the horizontal component intensity of the Sq variations in the following way: two different groups of conjugate stations were used to calculate the yearly average of the horizontal component intensity of the magnetic field. The horizontal component intensity was calculated with Eq. (2).
 (2)
(2)The horizontal component intensity for each hemisphere was taken as the average of the data from the selected three stations which represent each hemisphere at each local time. The first group of these conjugate stations (see Table 2) consisted of three pairs of ‘geographic’ conjugate stations: three representing the northern hemisphere, while the other three represent the southern hemisphere. From the data of these three geographic conjugate stations, the yearly average of the horizontal component intensity shows an asymmetry between the northern hemisphere and the southern hemisphere as shown in Fig. 3, where the black line (N-H) represents the intensity of the horizontal component of the northern hemisphere, while the grey line (S-H) represents the intensity of the horizontal component intensity of the southern hemisphere. The other group of conjugate stations consists of three pairs of ‘geomagnetic’ conjugate stations (see Table 3), and the intensity of the horizontal component tends to be symmetrical between the northern and southern hemispheres (see Fig. 4). Here, also, the black line (N-H) represents the intensity of the horizontal component of the northern hemisphere, while the grey line (S-H) represents the intensity of the horizontal component intensity of southern hemisphere. From this result, one can conclude that the geomagnetic equator in the African is very close to the real axis of Sq.
Fig. 2. 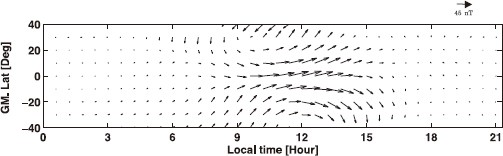
The equivalent Sq current system for the yearly average of all the stations of the African sector.
Fig. 3. 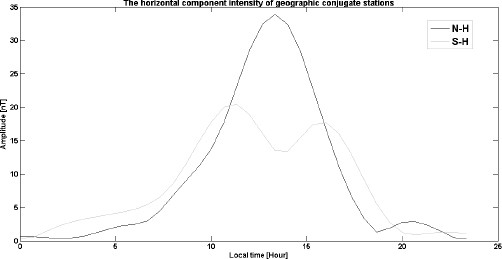
Comparison between the northern and the southern horizontal component intensity for geographic conjugate stations.
Fig. 4. 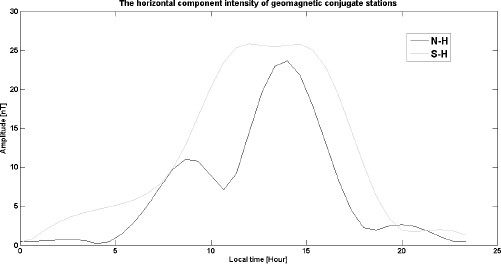
Comparison between the northern and the southern horizontal component intensity for geomagnetic conjugate stations.
Table 2. Station names and their geographic latitudes for the three pairs of geographic conjugate stations used in this study. Table 3. Station names and their geomagnetic latitudes for the three pairs of magnetic conjugate stations used in this study. -
(2)
Another interesting result is the disappearance of the northern hemisphere vortex during daytime hours (see Fig. 5). The absence of the northern vortex was accompanied by the appearance of the northward current in the northern hemisphere in the morning, which then reversed in the afternoon. Normally, the current system in the northern hemisphere is directed southward in the morning and northward in the afternoon. The disappearance of the northern hemisphere vortex was observed from January to March. The corresponding daily variations of this current can be found in Fig. 6. Panel (a) of Fig. 6 represents the H component of the magnetic field, and Panel (b) represents the D component of the magnetic field. In Fig. 6, the H component shows a normal behavior while the D component shows an abnormal behavior as the westward field in the morning hours dominates at all the stations. Normally, the Sq(D) in the northern hemisphere represents a well-defined eastward field in the morning hours, changing to a westward field during the noon hours (i.e. normally, the Sq(D) in the northern hemisphere is higher than the zero level in the morning sector and lower than the zero level in the afternoon). Our results in Fig. 6 show that the variations of the D component are lower than the zero level in the morning sector, which implies the existence of the northward current. By using incoherent scatter sound, Mazaudier and Venkateswaran (1985) also observed a northward current over Saint-Santin.
Fig. 5. 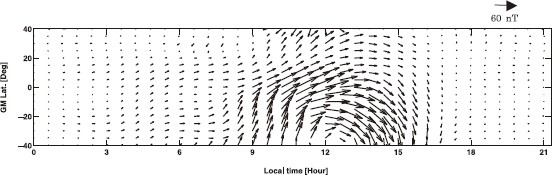
The equivalent Sq current system for February which shows clearly the northward currents.
Fig. 6. 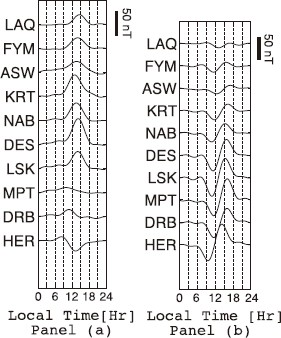
The monthly average shown in Panel (a) of the H component and Panel (b) of the D component for February 2009.
-
(3)
A dip equatorial station—Addis Ababa (0.57 dip latitude)—belonging to the 96° MM was added to the stations used in this study so that the equatorial current system in Africa could also be discussed. Figure 7 represents the monthly average of the magnetic field for February at all the African chain stations. Panel (a) represents Sq(H), while Panel (b) represents Sq(D). According to Chapman (1951), the amplitude of Sq(H) near the dip equator is higher than the amplitude of Sq(H) at other latitudes due to large eastward ionospheric currents in the dynamo region over the dip equator (i.e., equatorial electrojet). In Panel (a), the daily maximum of the Sq(H) at Addis Ababa appears between 1030 to 1130 LT, while at other low latitude stations the maximum appears around noon. According to Rastogi and Iyer (1976), during the minimum sunspot years, the maximum amplitude of Sq(H) appears before noon in the range between 1030 to 1130 LT. On the other hand, during the maximum sunspot years, the maximum of the amplitude of Sq(H) appears around noon. Since the results we represent here are for a minimum sunspot year, our results from Addis Ababa show such phase shift. One explanation for this phase shift in the maximum value of Sq(H) to occur before noon was suggested by Rastogi and Iyer (1976). The integrated current in the dynamo region can be expressed as the product of the electron number density (Ne), the electronic charge (e), and the westward electron drift velocity (v), so the current should be a maximum between the time of the maximum of the electron number density (Ne) and the westward electron drift velocity (v). The electron density becomes maximum around noon while the electric field (i.e. The westward electron drift velocity) has its maximum value near 9–10 LT. Thus, the suggested product maximum is around 11 LT. In Panel (b), Sq(D) at the station near the dip equator (i.e. AAB) shows a variation from the night-time level during 0600–1600 LT.
Fig. 7. 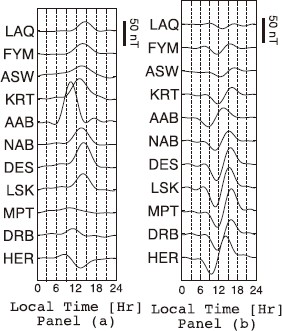
The monthly average shown here in Panel (a) of the H component and Panel (b) of the D component for February 2009 after adding the AAB station.
-
(4)
Figure 8 shows the appearance of two vortices on the sunlit side of the southern hemisphere in spring, which is the most interesting result and a new finding of the Sq current system in the African sector. The first vortex started early in the morning around 0600 LT and lasted until 0900 LT, while the other vortex had a focus around noon. Figure 9 shows the first vortex more clearly in a different time scale. A possible explanation is that it may be caused as a result of the counter elec-trojet (Gurubaran, 2002), but further research needs to be done to define this phenomena.
Fig. 8. 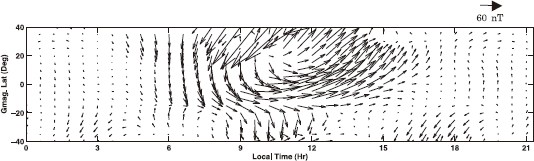
The equivalent Sq current system for May.
Fig. 9. 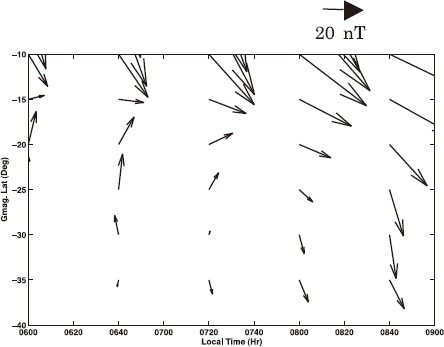
Focus on the morning vortex with a different local time scale.
-
(5)
From the data of the seasonal variations of both northern and southern hemispheres, it was found that there is an annual variation with the maximum amplitude of Sq(H) and Sq(D) occurring around the local summer of each hemisphere. In Figs. 10 and 11, the daily range averaged for different seasons is plotted. As shown in Fig. 10, in the northern hemisphere, the highest peak between the four seasons appears in the Northern Summer, for both H and D components. On the other hand, as shown in Fig. 11, the highest peak for the southern hemisphere appears in the Southern Summer. The absence of a semiannual variation in the seasonal variations and the domination of the annual variation for both H and D components were noticed.
Fig. 10. 
The seasonal variation of all stations of the northern hemisphere for the H component, and the D component.
Fig. 11. 
The seasonal variation of all stations of the southern hemisphere for the H component, and the D component.


4. Summary and Conclusion
-
(1)
There is an asymmetry in the shape of the Sq current pattern between the southern and northern hemispheres based on the yearly average calculations. The asymmetry in intensity appears in the yearly average of the horizontal component intensity of the Sq variations.
-
(2)
The absence of the northern current vortex and the appearance of the northward current in the northern hemisphere during morning were found.
-
(3)
At the dip equatorial station (AAB), the daily maximum value of the H component has been shifted to the range between 1030 to 1130 LT during a minimum sunspot year.
-
(4)
The most interesting result and a new finding from the analysis of the data from the African sector is the appearance of two vortices on the sunlit side of the southern hemisphere in spring.
-
(5)
Domination of the annual variation for both H and D components and the absence of semiannual variations were noticed.
References
Campbell, W. H., Annual and semiannual changes of the quiet daily variations (Sq) in the geomagnetic field at North American locations, J. Geophys. Res., 87, 5305–5308, 1982.
Chapman, S., The equatorial electrojet as detected from the abnormal electric current distribution above Hunacayo, Peru and Elsewhere, Arch. Met. Geophys. Bioklimatol., 44, 368–390, 1951.
Chapman, S. and J. Bartels, Geomagnetism, vol. 1: Geomagnetic and Related Phenomena, Oxford Univ. Press, London, 1940.
Gurubaran, S., The equatorial counter electrojet: Part of a worldwide current system?, Geophys. Res. Lett., 29, doi:10.1029/2001GL014519, 2002.
Matsushita, S., Sq and L current systems in the ionosphere, Geophys. J. R. Astron. Soc., 15, 109–125, 1967.
Matsushita, S., Upper-atmospheric tidal-interaction effects on geomagnetic and ionospheric variations—A review, Ann. Geophys., 33, 115–125, 1977.
Matsushita, S. and H. Maeda, On the geomagnetic solar quiet daily variations field during the IGY, J. Geophys. Res., 70, 2535–2558, 1965.
Mazaudier, C. and S. V. Venkateswaran, Strange currents over Saint-Santin, J. Geophys. Res., 90, 9727–9735, 1985.
Miyahara, S. and M. Ooishi, Variation of Sq induced by atmospheric tides simulated by a middle atmosphere general circulation model, J. Geomag. Geolectr., 49, 77–87, 1997.
Onwumechili, C. A., A study of rocket measurements of ionospheric currents-I. General setting and night-time ionospheric currents, Geophys. J. Int., 108, 633–640, 1992.
Rastogi, R. G. and K. N. Iyer, Quiet day variation of geomagnetic H-field at low latitudes, J. Geomag. Geolectr., 28, 461–479, 1976.
Takeda, M., Features of global geomagnetic Sq field from 1980 to 1990, J. Geophys. Res., 107(A9), doi:10.1029/2001JA009210, 2002.
Yumoto, K., G. Maeda, S. Abe, T. Uozumi, A. Fujimoto, A. Ikeda, T. Tokunaga, Y. Yamazaki, T. Ueno, Y. Hirayama, B. Rabiu, C. B. S. Uiso, P. Baki, K. M. Badi, L. B. Kolawole, T. Afullo, A. Macamo, H. Mweene, and MAGDAS/CPMN Group, Progress report on the global deployment of MAGDAS, Sun and Geosphere, 2009 (in press).
Yumoto and MAGDAS/CPMN Group, A review of MAGDAS/CPMN project during IHY, Nigerian J. Space Res., 2010.
Acknowledgments
The authors would like to thank Kyushu University friendship scholarship and Helwan University for financial support. All thanks to the MAGDAS project for supporting the observational data and some analysis equipment for this study. The first author would like to thank the SERC staff and SWMC staff for their support to finish this study.
Author information
Authors and Affiliations
Corresponding author
Rights and permissions
Open Access This article is licensed under a Creative Commons Attribution 4.0 International License, which permits use, sharing, adaptation, distribution and reproduction in any medium or format, as long as you give appropriate credit to the original author(s) and the source, provide a link to the Creative Commons licence, and indicate if changes were made.
The images or other third party material in this article are included in the article’s Creative Commons licence, unless indicated otherwise in a credit line to the material. If material is not included in the article’s Creative Commons licence and your intended use is not permitted by statutory regulation or exceeds the permitted use, you will need to obtain permission directly from the copyright holder.
To view a copy of this licence, visit https://creativecommons.org/licenses/by/4.0/.
About this article
Cite this article
El Hawary, R., Yumoto, K., Yamazaki, Y. et al. Annual and semi-annual Sq variations at 96° MM MAGDAS I and II stations in Africa. Earth Planet Sp 64, 425–432 (2012). https://doi.org/10.5047/eps.2011.10.013
Received:
Revised:
Accepted:
Published:
Issue Date:
DOI: https://doi.org/10.5047/eps.2011.10.013