- Full paper
- Open access
- Published:
First in-orbit results of the vector magnetic field measurement of the High Precision Magnetometer onboard the China Seismo-Electromagnetic Satellite
Earth, Planets and Space volume 71, Article number: 119 (2019)
Abstract
The High Precision Magnetometer (HPM) is one of the main payloads onboard the China Seismo-Electromagnetic Satellite (CSES). The HPM consists of two Fluxgate Magnetometers (FGM) and the Coupled Dark State Magnetometer (CDSM), and measures the magnetic field from DC to 15 Hz. The FGMs measure the vector components of the magnetic field; while the CDSM detects the magnitude of the magnetic field with higher accuracy, which can be used to calibrate the linear parameters of the FGM. In this paper, brief descriptions of measurement principles and performances of the HPM, ground, and in-orbit calibration results of the FGMs are presented, including the thermal drift and magnetic interferences from the satellite. The HPM in-orbit vector data calibration includes two steps: sensor non-linearity corrections based on on-ground calibration and fluxgate linear parameter calibration based on the CDSM measurements. The calibration results show a reasonably good stability of the linear parameters over time. The difference between the field magnitude calculated from the calibrated FGM components and the magnitude directly measured by the CDSM is just 0.5 nT (1σ) when the linear parameters are fitted separately for the day- and the night-side. Satellite disturbances have been analyzed including soft and hard remanence as well as magnetization of the magnetic torquer, radiation from the Tri-Band Beacon, and interferences from the rotation of the solar wing. A comparison shows consistency between the HPM and SWARM magnetic field data. Observation examples are introduced in the paper, which show that HPM data can be used to survey the global geomagnetic field and monitor the magnetic field disturbances in the ionosphere.

Introduction
The China Seismo-Electromagnetic Satellite (CSES) was launched successfully on 2nd February, 2018. CSES, as the first space-based electromagnetic monitoring platform in China, will be used for seismic observation and geophysical field measurement. The global electromagnetic field, plasma, and energetic particle data obtained by CSES can be used to monitor and study the ionospheric perturbations (Shen et al. 2018). CSES is a sun synchronous satellite, with an altitude of approx. 507 km and an inclination angle of about 97.4°. The local time of the descending node is 14:00 and the revisit period is 5 days (Shen et al. 2018). CSES is designed to measure various ionospheric parameters with several payloads. The DC-20 kHz magnetic field variations are detected by the High Precision Magnetometer (HPM) (Cheng et al. 2018) and the Search Coil Magnetometer, while the DC-3.5 MHz electric field is explored by the Electric Field Detector. Other plasma parameters are detected and analyzed by the Langmuir Probe, the Plasma Analyze Probe, the GNSS Occupation Receiver, and the Tri-Band Beacon (TBB). The High Energy Particle Package and the High Energy Particle Detector can monitor particle radiation from 200 keV to 200 MeV.
The magnetic field at CSES’s orbital height is mainly composed of the Earth’s core magnetic field, the crustal magnetic fields, and the magnetic fields generated by the ionospheric and magnetospheric current systems. According to the International Geomagnetic Reference Field (IGRF) model (Thébault et al. 2015), the maximum northward magnetic field is about 30,000 nT near the equator, the maximum downward magnetic field is about 50,000 nT in the polar regions, and the maximum eastward magnetic field is about 10,000 nT. The Earth’s core and the crustal magnetic fields are dominant; however, the ionospheric and magnetospheric current systems may cause several hundred nano-tesla disturbances in the magnetic field (Liu et al. 2018). Some magnetic field pulsations may be registered as 0.1 to several tens of nT disturbances within a band of DC-15 Hz in the ionosphere.
The aim of the HPM onboard the CSES is to accurately distinguish the change of the local magnetic field vector when revisiting the same area and to detect the magnetic field disturbances from DC to 15 Hz. To meet these targets, HPM should have a measurement bandwidth of DC-15 Hz to detect possible magnetic field disturbances and to follow magnetic field changes due to CSES’s orbital motion, which is estimated to be 150 nT/s in the downward component of the magnetic field. And, most important, accuracy in vector magnetic field measurement is required.
The HPM was developed by the National Space Science Center (NSSC) of the Chinese Academy of Sciences, in cooperation with the Space Research Institute (IWF) of the Austrian Academy of Sciences and the Institute of Experimental Physics (IEP) of the Graz University of Technology (Cheng et al. 2015). This paper will introduce the measuring principles of the HPM, focusing on the performances, calibration results, and analysis on first in-orbit data of the FGMs.
Instrument characteristics and description
The HPM consists of two FGMs (Fig. 1b), a CDSM (Fig. 1c) and a Digital Control Unit (DCU, Fig. 1a). The FGMs measure the vector components of the magnetic field from DC-15 Hz, while the CDSM detects the magnitude with higher accuracy (Cheng et al. 2018). The linear parameters of the FGMs can be calibrated using the more accurate scalar magnetic field data from the CDSM (Zhou et al. 2014). The DCU powers the FGM and the CDSM subunits, receives science and housekeeping data from the subunits, and transmits them to the satellite.

Pictures of the HPM subunits. a DCU (Digital Control Unit, middle two layers) with the two FGMs (bottom) and CDSM readout electronics on top; b two FGM sensors; c CDSM sensor
All sensors of the HPM are mounted on the outermost segment of the 4.7 m-long boom to reduce the magnetic interferences from the satellite. The boom consists of three hinges and three segments made from carbon fiber material. It is installed on the +z plane of the satellite and is nadir-pointing. The CDSM sensor is mounted on the tip of the boom, because it is the reference for the in-orbit calibration. The two FGM sensors are located between the CDSM sensor and the satellite body. The sensor coordinate system is defined in Fig. 2. The FGM z-axes point to the satellite flight direction, FGM y-axes point to the Earth center, while FGM x-axes are normal to the satellite orbital plane Fig. 2. On the boom, the distance from FGM1 to boom root is 3946 mm, from FGM1 to FGM2 is 400 mm and from FGM2 to CDSM is 367 mm. All sensors are wrapped in multi-layer thermal blankets for thermal control purposes.

Drawing of satellite with the HPM sensors on the boom and sensor coordinate system. All three sensors are mounted on the outermost segment of the boom, when the CDSM sensor is mounted on the tip and two FGM sensors are located between the CDSM and spacecraft body
Fluxgate magnetometer
The FGM is inherited from the Yinghuo-1 magnetometer (Zhou et al. 2009). Each FGM sensor consists of three components, which are mounted orthogonally to each other (Fig. 3a). Each component has three separate coils: a signal coil, a feedback coil, and an excitation coil (Fig. 3b). The latter is wound on a toroidal core, which is made of a multi-layered Permalloy strip.

FGM sensor configuration. a FGM sensor consists of three orthogonal components (shown as brown units); b each component consists of three coils: excitation coil, feedback coil, and signal coil
Figure 4 shows the FGM front-end electronics, which is based on a traditional fluxgate analog signal processing circuit. The electronics and sensors have been well matched in the laboratory, and the noise level of the sensor itself can reach 3 \( {\text{pT}}/\sqrt {\text{Hz}} \) (Zhou et al. 2009). The HPM uses Analog-to-Digital Converters (ADC) for the signal processing of each component. With an implemented full-scale measurement range of ± 70,000 nT and sampling rate of 60 Hz, the noise of each AD circuit reaches 18 \( {\text{pT}}/\sqrt {\text{Hz}} \), in accordance with the in-orbit data evaluation results, which implies that the AD circuit limits the noise level of the FGM, and the noise level of the FGM can be further reduced if the sampling circuit is improved.

FGM signal processing diagram. FGM signal processing electronics includes excitation current diver, feedback current driver, and weak signal processing circuit
CDSM
The Coupled Dark State Magnetometer (CDSM) is an optical scalar magnetometer. The measurement principle utilizes two-photon spectroscopy of free rubidium atoms. The Zeeman effect in combination with a quantum interference effect called Coherent Population Trapping (CPT) results in narrow resonance features and a precise determination of the magnetic field-dependent Zeeman energy level shifts (Lammegger 2008).
Three magnetic field-dependent resonances arise in the presence of an external magnetic field at different angles between the magnetic field direction and the optical path of the sensor unit. The resonance for the magnetic field measurement is selected as a function of the angle (Pollinger et al. 2012). No moving parts, feedback coils, and active electronics at the sensor are needed for an omni-directional magnetic field measurement. Furthermore, the CDSM uses three CPT resonances in parallel which reduces systematic errors significantly (Lammegger 2008; Pollinger et al. 2018).
Figure 5 shows the block diagram of the CDSM flight model, which consists of the mixed signal electronics board and the laser unit which are mounted in the instrument box. The sensor unit is connected to the electronics with two fibers and two twisted pair cables. Five control loops are required to track the magnetic field-dependent Zeeman resonances, to track the rubidium D1 fine structure transition with the current and temperature dependent laser carrier frequency, to track the rubidium D1 hyperfine structure transition with the microwave generator, and to heat the sensor unit for temperatures below 18 °C (Pollinger et al. 2018).

CDSM block diagram. A/D analog-to-digital conversion, D/A digital-to-analog conversion, DDS direct digital synthesis, FPGA field programmable gate array, H/K housekeeping, PWM pulse-width-modulation, Rb rubidium, TEC thermo-electric-cooler, VCSEL vertical cavity surface emitting laser
Digital control unit
The HPM DCU serves as the power supply for both FGMs and the CDSM, collects the FGM analog signals, receives the CDSM digital signal, and transmits the collected data to the satellite through two different communication channels, as shown in Fig. 6. To improve the reliability of the power supply and communication, the DCU is cold redundantly designed.

Data flow in DCU. SPI serial peripheral interface, CAN controller area network, DT data transmission, OBDH on-board data handling, MCU micro-control unit
The acquisition timing of HPM is set by the DCU Field Programmable Gate Array (FPGA). Six ADCs are used for the six FGM sensor components and all are triggered by the DCU FPGA. This guarantees that the data from all FGM channels are synchronous. Additionally, the DCU FPGA sends a data request command to the CDSM. The command synchronizes the data acquisition of CDSM to the FGMs and triggers the transmission of the latest science data to the DCU. There is a fixed time delay between the CDSM and the FGM data, which is easy to handle during data processing.
There are two different channels for sending data to the satellite. One is the Serial Peripheral Interface (SPI) interface, while the other is the Controller Area Network (CAN) bus interface. The communication of the SPI interface is initiated by HPM. When data are ready, HPM starts to transit to the Data Transmission (DT) subsystem of the satellite. There, all data are stored and sent to ground via a high-gain antenna when the satellite is over some ground stations. The full sampling rate of each HPM instrument is transferred via this channel. Additionally, the CAN bus interface is used for payload health checks. The data are requested by the On-Board Data Handling (OBDH) subsystem of the satellite with an update rate of 1 Hz.
According to the CSES main goal, the satellite is designed to monitor earthquakes in areas located within a latitude of ± 65º. Accordingly, the DT subsystem of the satellite will be switched off at higher latitudes, while the OBDH keeps working all time. Therefore, the full sampling rate of each HPM instrument is currently only available within ± 65º latitudes, while the 1 Hz data cover entire orbits.
Ground tests
Before launch, the HPM Flight Model and the whole satellite carried out a series of ground tests, including linearity, noise, thermal drift, orthogonality and alignment calibration of the FGM sensors, linearity, noise and accuracy tests with the CDSM, as well as the determination of satellite and inter-sensor interferences. With the ground tests, on one hand, the performances of HPM are verified; and on the other hand, a set of data processing parameters for in-orbit correction could be determined.
The performances of HPM are shown in Table 1.
FGM thermal drift calibration
According to the FGM measuring principle, the analog output signal of the FGM has a linear relationship with the ambient magnetic field strength. However, the magnetic core material of the sensor, the coil characteristics and the amplifier parameters are all affected by the ambient temperature. This results in thermal drift of the coefficients of the linear relationship between the FGM output signal and magnetic field. From the test results, we find that each component has different pattern of drift which needs to be calibrated one by one. When mounted on the satellite, the sensors on the boom and electronics inside the satellite body are under different thermal conditions. The sensors and the electronics are separately calibrated under different temperatures and the results are combined by linear superposition. Four sets of temperature calibration were carried out, as indicated by dot and dash lines in Fig. 7, to interpolate the thermal drift of offset and gain in the whole temperature domain. The thermal drifts in offset and gain are shown in Figs. 8 and 9, respectively, which vary from sensor to senor.
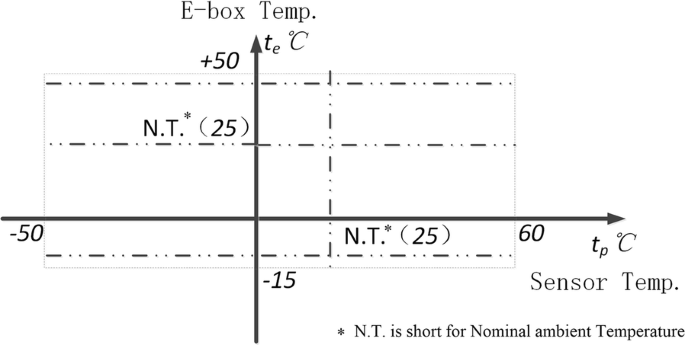
The temperature setup (dot and dash lines) for four sets of thermal drift calibration tests, see in figure. N.T. means nominal ambient temperature

Offset thermal drift (in nT) as a function of sensor temperature and electronics temperature

Gain factor thermal drift as a function of sensor temperature and electronics temperature
CDSM sensor heading characteristic calibration
The CDSM measures a deviation of the actual magnetic field strength which depends on the angle between the light propagation direction of the sensor and the measured magnetic field. These heading characteristic is repeatable and was finally determined during performance tests in the assembled HPM configuration at the Fragrant Mountain Weak Magnetic Laboratory of the National Institute of Metrology in China.
For the CDSM, valid data are extracted, the sensor heading characteristic is applied, and the fluxgate and satellite interferences are removed. Details on this process and investigations on the CDSM data quality will be published elsewhere.
The satellite magnetic interference calibration
Several efforts were taken to reduce the magnetic field interferences caused by the satellite. The satellite platform development followed a magnetic cleanliness program and a 4.7 m-long boom was designed for the HPM sensors. After integration, magnetic tests were carried out to determine magnetic interferences of the satellite on the magnetometers. The satellite interference model is defined as:
where A is the magnetic susceptibility of the satellite, B0 is the external magnetic field, BC is the hard remanence of the satellite, C is the variation of remanence due to different magnetization directions of magnetic torquer, and I is a parameter related with the magnetic torquer magnetization direction. Due to the operational strategy of the magnetic torquer on the satellite, the remanence caused by the soft magnetic material will change with different directions of torquer magnetization.
The satellite magnetic interference tests were carried out in a three-dimensional square coil system with a side length of 16 m. The satellite was located in the center of the system and the Earth’s magnetic field was compensated with the coils. The remanence model was established by rotating the satellite and the interference of the satellite at the position of the magnetometer sensors was accurately measured.
To determine the hard remanence, the first test was carried out under nearly zero magnetic field and the remaining satellite magnetic field was measured to obtain BC, which is less than 0.29 nT at the CDSM sensor position. For the determination of the soft remanence, magnetic field was applied in different directions in a second test, and the magnetic induction coefficient matrix A was obtained. In a third test, the magnetization direction of the magnetic torquer was changed and the magnetic field disturbance of the satellite was measured to obtain C. All these tests were repeated several times and the uncertainty of the calibration results was less than 0.3 nT (Xiao et al. 2018).
Interference magnetic field from the FGM feedback coil
The magnetic field generated by the FGM sensor feedback coil has the same magnitude but opposite direction of the external magnetic field. The feedback coil is small in diameter and the generated disturbing magnetic field will decay rapidly. Dependent on the distance, this may become a significant interference to other sensors. By applying a constant current into the feedback coil, the interference to the adjacent sensor is measured; the measurement value and the interference coefficient matrix are calculated (Zhou and Cheng 2018).
The magnetic interference from feedback coil is greater when the ambient magnetic field is larger, especially along the boom, which is aligned with the Y-axis of FGM sensor, pointing to the Earth. When the outboard sensor of FGM works under 50,000 nT, the magnetic interference is about 4 nT at the position of CDSM sensor. This magnetic interference is determined by the size of FGM feedback coil, the number of windings, and the working current, which is stable in-orbit. Therefore, it can be effectively eliminated with the ground calibration data.
In-orbit calibration
The FGM in-orbit data calibration includes two steps, the sensor non-linear corrections and fluxgate linear parameter calibration (Zhou et al. 2018). The sensor non-linear correction eliminates the influence of non-linear factors in the FGM and CDSM measurements. Two non-linear corrections are applied, the temperature correction of FGM and CDSM heading characteristic correction. According to the FGM principle, the raw signal observed by FGM sensor is linearly related to the magnetic field. It can be shown by Eq. (1), where Bx is the magnetic field in nT. Fx is observed signal value by FGM x component. a and c are gain and offset:
Ground calibration indicates that a and c have thermal drifts, which are not negligible in a near Earth orbit mission. The sensor temperature and the electronics temperature are measured in-orbit, as shown in Fig. 10. The sensor has a temperature change of about 10 °C from day-side to night-side, while the temperature of the electronics is relatively stable. The temperature correction of the FGM x component is shown as an example in Eq. (2), where \( B_{x}^{'} \) is the magnetic field after thermal correction in nT. The ATx and CTx can be obtained from Figs. 8 and 9 by interpolation according to the electronics temperature te and sensor temperature tp:

DCU and FGM2 sensor temperature variations in-orbit
The thermal correction values, Bx − B′x in the case of x component, are shown in Fig. 11 for three FGM axes.

FGM non-linear errors which can be corrected through thermal drift correction
For the correction of the CDSM heading characteristic, the angle between the ambient magnetic field and the CDSM optical axis is calculated with the FGM vector data. After the sensor non-linear correction, the data can be assumed to have a linear relationship with the ambient magnetic field.
The FGM linear calibration uses the scalar magnetic field data of the CDSM to calibrate the linear parameters of the FGM in orbit. This method is similar to the linear model used for Ørsted satellite (Olsen et al. 2003). The basic principle of this method is the mathematical relation between the vector and scalar quantities, as shown by Eq. (3):
where BX, BY, and BZ are the three-component magnetic field in an orthogonal coordinate system. The FGM components are not strictly orthogonal, and the gains and offsets calibrated on ground may change slightly in orbit; therefore, the (Bx, By, Bz) from FGM are related to the orthogonal 3-component magnetic field (BX, BY, BZ) by Eq. (4):
Combining Eqs. (3) and (4) gives the mathematical relation between the scalar magnetic data and vector magnetic data, which has nine parameters including orthogonal angles, gains, and offsets of three components. The calibration results show that the linear parameters are significantly different between the day- and night-side orbit segments. This difference might be caused by the mathematical model or by change of the satellite status between the day- and night-side. Therefore, the linear parameters are fitted separately for the day- and night-side. The nine calibration parameters are quite stable over time. The difference between the field magnitude calculated from the calibrated FGM components and the magnitude directly measured by the CDSM is about 0.5 nT (1σ). The upper panel in Fig. 12 shows the statistics of scalar residues between the FGM1 and the CDSM, with red line shows the day-side residues and blue line shows the night-side residues. The lower one shows the statistics of scalar residues between the FGM2 and the CDSM. The major reason for larger residues of the FGM1 is that satellite remanence cannot be removed totally and the FGM1 sensor is susceptible to the satellite interferences, because it is the inboard sensor and closer to the spacecraft.

Scalar residues between FGM1, FGM2, and CDSM. Red dayside residue, Blue nightside residue. The difference between the field magnitude calculated from the calibrated FGM components and the magnitude directly measured by CDSM is about 0.5 nT (1σ) which is stable over time
Figure 13 and Table 2 show the linear calibration results for data from March 7th, 2018 to November 15th, 2018. The FGM linear parameters are stable; however, these parameters will be updated routinely every day.

Time variations of FGM1 and FGM2 linear parameters, gain factors, offsets, and orthogonal angles from March 7th, 2018 to November 15th, 2018
The gain and offset linear parameters of x component show higher noise compared to the other axes. This axis aligns with the normal direction of the spacecraft’s orbital plane. Therefore, the measurement covers only several thousand nano-tesla which leads to poorer calibration results for this axis.
In-orbit data analysis
Satellite interference to HPM measurements
Interference from magnetic torquer
The satellite magnetic torquer is designed to work at latitudes of ± 65° or higher. Once working, it will generate interferences of about 100 nT on the HPM sensors. The magnetic torquer basically does not work within latitudes of ± 65°. However, to better control the satellite remanence, when any component of the geomagnetic field becomes zero, the magnetic torquer will start working according to the future direction of the field to magnetize its inner core for 2 s. The zero of magnetic field component is based on a calculation by the satellite according to the geomagnetic field model. Figure 14 shows globally operation of the magnetic torquer on 24th August, 2018.

Global distribution of the magnetic torquer operation on 24th August 2018. When any component of the geomagnetic field becomes zero, the magnetic torquer will magnetize its inner core for 2 s
The high sampling rate data transmitted through the SPI channel are rarely affected by the interference of magnetic torquer. While the global coverage telemetry data transmitted through the CAN bus are contaminated by the magnetic torquer at 65º latitude or higher. At present, the interference of the magnetic torquer is not removed from the data, and the data user can judge the status of the magnetic torquer according to the data quality flag. The subsequent data analysis in this paper uses high sampling rate data transmitted by SPI channel.
The magnetic torquer utilizes the time pulse-width modulation mode, so the interference strengths match well every times it works. Figure 15 shows the FGM z component when the magnetic torquer works in the equatorial region for 2 s. In Fig. 15a, the background magnetic field was averaged and subtracted from the FGM data to show the magnetic field interference of the magnetic torquer. Due to the permeability of the soft magnetic material inside the magnetic torquer, the magnetic field produced by the magnetic torquer has an obvious hysteresis. Before and after the operation of the magnetic torquer, the background residuals vary under different magnetization directions in Fig. 15b, which is consistent with the results of ground magnetic test of the satellite. With the ground calibration data, this influence can be accurately eliminated.

The magnetic field disturbances on FGM measurements. a The magnetic field disturbances on FGM2 z component when the magnetic torque operates. Nine data series are shown. The magnetic torquer utilizes the time pulse-width modulation mode, so the interference strengths match well every times it works. b The residues under different magnetization directions vary. With the ground calibration data, this difference can be accurately eliminated
Interference from the Tri-Band Beacon instrument
The Tri-Band Beacon (TBB) is a three-frequency radio beacon instrument developed to provide transmission at Very High Frequency (VHF), Ultra High Frequency (UHF), and L-band (150/400/1067 MHz) (Chen et al. 2018). The antenna of the TBB and the boom for HPM sensors are both deployed on the +z plane of the satellite. When TBB transmits signals to ground, the signals may be coupled into the HPM sensor harness cables and appear as interferences on the FGM measurements. Figure 16 shows a comparison of the magnetic field measured by the HPM and the IGRF model when the TBB is operating. It can be seen that TBB has different interferences to the three components of the FGM. The CDSM sensor signal transmission is through optical fiber, so the TBB does not influence the CDSM.

Interferences caused by the TBB. When Tri-Band Beacon transmits signals to ground, the FGM measurements are disturbed
By checking the scalar difference between the FGM and the CDSM, the TBB generated interference can be clearly identified. The TBB is only operated when its signals can be received by the cooperating ground stations in mainland China which means that the interferences to the FGM measurements are very limited. In HPM data, the interferences from the TBB are not removed, and the data are marked by a quality flag when interfered by the TBB.
Interference from rotation of the solar wing
Currently, CSES always rotates its solar wing in orbit. During the rotation of the solar wing, some micro-vibrations are transmitted to the FGM sensors through the satellite platform and boom. Figure 17 compares the spectrum of the FGM data when the solar wing rotates with data when it does not. It can be seen that when the solar wing is still, the spectrum of the FGM is very clean. While the solar wing is rotating, interferences at several specific frequencies can be found as indicated by the arrows in right panel. Figure 18 shows the Power Spectral Density (PSD) of FGM data after high-pass filtering with a cut-off frequency of 0.1 Hz and the solar wing not rotating. This can be interpreted as the noise level of FGM. Through long-term analysis and statistics, the noise of each component of the FGM sensor can be determined to better than 18 \( {\text{pT}}/\sqrt {\text{Hz}} \) @1 Hz. In this case, unnatural interferences only occasionally occur at approximately 0.7 Hz on day-side. When the solar wing rotates, the noise of the FGM does not change, but interferences occur at several frequencies below 1.25 Hz and their appearances have a certain correlation with the orbital position. The detailed mechanism is still under investigation. Users are cautioned about analyzing geomagnetic pulsations at these frequencies.

Influence of the rotation of the solar wing. Two revisit orbits under quiet geomagnetic condition were selected to compare the influence of the rotation of the solar wing. The left panel shows the spectrum of the FGM components when the solar wing does not rotate on 2nd May 2018, while the right panel shows the spectrum when the solar wing rotates on 11th June 2018. Several specific frequency interferences can be identified when the solar wing is rotating

In-orbit noise Power Spectral Density (PSD) of FGM1 and FGM2. The data are high-pass filtered with a cut-off frequency of 0.1 Hz and the solar wing does not rotate
Comparison of FGM scalar data and CDSM scalar data
The difference between the scalar magnetic field data from the CDSM and calculated by the FGM is larger than 100 nT before linear calibration of the FGM. The deviation between the two scalar magnetic field values could be smaller than 0.5 nT or even reach zero if FGM parameters are adequately corrected. Figure 19 shows the scalar deviation between the FGM1, FGM2, and CDSM when the data interfered by the TBB and the magnetic torquer are removed. The mean values of the scalar deviation of any of the two sensors is below 0.1 nT, the scalar variance of the FGM1 and the CDSM is 0.61 nT, the scalar variance of the FGM2 and the CDSM is 0.43 nT, and the scalar variance of the FGM1 and the FGM2 is 0.5 nT. The results show good consistency of three sensors, after in-orbit linear correction.

The scalar deviations between FGM 1, FGM 2 and CDSM data are from August 2018; the interferences from the TBB and the magnetic torquer are removed before calculating deviations
Comparison with SWARM satellite data
The magnetic field data of the CSES and SWARM satellites can be compared. However, the altitudes of CSES and the three SWARM satellites are different. Also times at which the satellites fly over the same latitude/longitude intersections are different and a direct comparison would result in relatively large differences.
The CHAOS model is a geomagnetic model developed using satellites and ground observation data. The influences of the ring current are also considered (Olsen et al. 2006). Using the CHAOS model as a reference:
the deviation caused by the differences in time and orbit altitude can be reduced.
Figure 20 shows the Dst index and Kp index from August 30 to September 3, 2018, which are provided by World Data Center for Geomagnetism, Kyoto. It can be seen that the geomagnetic field in this period is relatively quiet, and CSES and SWARM data are compared for this period of time. Results and statistics are shown in Fig. 21 and Table 3. The comparison shows that both the vector and the scalar differences are quite consistent. The deviation of the vector data is latitude-dependent. Changes of the solar illumination on the satellite cause a deformation of the HPM boom and the satellite structure. The orientation relationship between the vector magnetic field sensors and the star sensors changes.

The Dst index and Kp index from August 30 to September 3, 2018

Comparison of CSES and SWARM B magnetic field data, from August 30 to September 3, 2018
The uncertainty of vector magnetic field data reflects the uncertainty in sensor alignment. According to the comparison results, the uncertainty of sensor alignment is about 0.01–0.05°, depending on latitude.
Application
Observation of dynamic change of the magnetic field during a geomagnetic storm
Figure 22 shows the magnetic field northward, eastward components and scalar magnitude observed by the FGM when flying over the geomagnetic equator during a magnetic storm event in August 26–27, 2018, after subtracting the geomagnetic field (main field and lithosphere field) determined by the Chaos model. We can see that the storm time variations are most prominent in the northward component (upper panel); the eastward field shows small increase with the start of the main phase and reached a peak around the end of the main phase (middle panel). At magnetic equator, the downward component is zero, and the variations in the magnitude of the field mainly follow the variations in the northward component. Generally, day-side is more disturbed than night-side. The magnetic field variation is consistent with the trend of Dst index. The main phase and recovery phase during the magnetic storm can be clearly seen from the data. Sudden commencement and initial phase are not obvious both in the Dst and FGM data. Because CSES orbit has a fixed local time (2 a.m./p.m.), which is quite different from the C/NOFS satellite in Le et al. (2011). Instead of observing the local time dependence of the ring current effect, CSES observes the temporal change of the ring current at a fixed local time.

Northward, eastward component and scalar magnitude variations are observed during the magnetic storm in August, 2018
Pc1 pulsation during the recovery phase of a geomagnetic storm
During the magnetic storm on August 27, 2018, CSES and SWARM observed the Pc1 pulsations which are shown in Fig. 24. The magnetic storm was in the recovery phase when this event was observed. The interplanetary magnetic field was in the northward direction and the solar wind pressure was about 1.8nPa accompanied by an increase of the AE index. The CSES and SWARM-C satellites were located in the southern hemisphere with about 1000 km in between. Figure 23 shows the positions of CSES and SWARM when they observed the Pc1 pulsation. The bottom and top panels in Fig. 24 are wavelet analyses of the CSES and SWARM-C magnetic field observation data during this event. The pulsation, which has a central frequency of ~ 2 Hz, was first observed by SWARM-C at (50.9°E, 49°S) and then by CSES at (53.3°E, 47.7°S) for about 1 min. This observation suggests that pulsation is the EMIC wave triggered by the injection of energetic ions in the ring current during the magnetic storm recovery phase (Cornwall 1965).

Positions of CSES and SWARM when they observed the Pc1 pulsation

Pc1 pulsation observed by SWARM-C (top) and CSES (bottom) magnetic field data on August 27, 2018 in the southern hemisphere; the two satellites are separated about 1000 km in between
Discussion and conclusion
The HPM onboard the CSES mission has been working normally in orbit for more than 1 year and measures the DC-15 Hz vector magnetic field. This article systematically introduces the design of the HPM, ground tests, and calibration as well as data processing methods. Through in-orbit data analysis and comparison, it is shown that FGM can provide consistent data with a standard deviation less than 0.5 nT (1σ) compared to the CDSM, an direction uncertainty of the magnetic field vector of 0.01° to 0.05°, a bandwidth of 15 Hz, and noise lower than 18 pT Hz−1/2@1 Hz. The data quality of the HPM is expected to improve when the sun-dependent satellite structure deformation and additional magnetic torquer interference reduction are considered in the future.
The transverse field effect of each sensor component and non-orthogonal effect between the coils are linearly corrected at present. The residues caused by these effects are reflected in the scalar differences after correction. In future, we will use polynomial fitting to evaluate these effects.
The day- and night-side differences of the FGM linear parameter correction are a problem that needs to be further investigated. This inconsistency means that some parameters of the HPM or spacecraft change during day and night. At present, the reasons for the change have not been confirmed. Further data analysis will be done to identify sources of interference to improve calibration results.
The comparison of the vector data with SWARM satellite data, especially at high latitudes, shows that there is an obvious deviation of alignment which is possibly caused by two reasons needed to be further analyzed. First, the linear parameters used for the FGM data correction are average values calculated every half-orbit, either day- or night-side, which only ensures accurate correction in low-latitude area. Second, during data processing, the transformation matrix from sensor coordinate system to star-camera coordinate system is fixed, which cannot reflect its change with the external environment. There might be a deviation in high latitude region. In the future work, the solar illumination-related variation of the sensor and coordinate transformation matrix will be studied and mathematical models will be established, expecting to improve the accuracy of the vector data.
Availability of data and materials
The CSES data sets analyzed during the current study will be available in the repository of Center for Satellite Application in Earthquake Science, Institute of Crustal Dynamic, China Earthquake Administration, with the website link http://www.leos.ac.cn.
The SWARM data sets analyzed during the current study are available in the repository of earth.esa.int/swarm.
The Dst and AE used in this paper was provided by the WDC for Geomagnetism, Kyoto (http://wdc.kugi.kyoto-u.ac.jp/wdc/Sec3.html). The Kp index used in this paper was provided by GeoForschungsZentrum (GFZ) Potsdam (https://www.gfz-potsdam.de/en/kp-index/).
Abbreviations
- HPM:
-
High Precision Magnetometer
- CSES:
-
China Seismo-Electromagnetic Satellite
- FGM:
-
Fluxgate Magnetometer
- CDSM:
-
Coupled Dark State Magnetometer
- TBB:
-
Tri-Band Beacon
- IGRF:
-
International Geomagnetic Reference Field
- DCU:
-
Digital Control Unit
- CPT:
-
Coherent Population Trapping
- SPI:
-
Serial Peripheral Interface
References
Chen L, Ou M, Yuan YP, Sun F, Yu X, Zhen WM (2018) Preliminary observation results of the Coherent Beacon System onboard the China Seismo-Electromagnetic Satellite-1. Earth Planet Phys 2(6):505–514. https://doi.org/10.26464/epp2018049
Cheng BJ, Zhou B, Magnes W, Lammegger R, Pollinger A, Ellmeier M, Hagen C, Jernej I (2015) Performance of the engineering model of the CSES high precision magnetometer. In: Proceeding of the IEEE Sensors. IEEE Sensors, Busan, 2015. https://doi.org/10.1109/icsens.2015.7370679
Cheng BJ, Zhou B, Magnes W, Lammegger R, Pollinger A (2018) High precision magnetometer for geomagnetic exploration onboard of the China Seismo-Electromagnetic Satellite. Sci China Technol Sci 61(5):659–668. https://doi.org/10.1007/s11431-018-9247-6
Cornwall JM (1965) Cyclotron instabilities and electromagnetic emission in the ultra low frequency and very low frequency ranges. Geophys Res 70:61. https://doi.org/10.1029/JZ070i001p00061
Lammegger R (2008) Method and device for measuring magnetic fields German Patent WO/2008/151344 (WIPO) https://patentscope.wipo.int/search/en/detail.jsf?docId=WO2008151344
Le G, Burke WJ, Pfaff RF, Freudenreich H, Maus S, Lühr H (2011) C/NOFS measurements of magnetic perturbations in the low-latitude ionosphere during magnetic storms. J Geophys Res 116:A12230. https://doi.org/10.1029/2011JA017026
Liu XW, Li L, Zhang YT, Xue HB (2018) Ionospheric currents and nightside ionospheric magnetic fields calculated by TIE-GCM. Chin J Space Sci 38:29–36. https://doi.org/10.11728/cjss2018.01.029
Olsen N, Tøffner-Clausen L, Sabaka TJ, Brauer P, Merayo JMG, Jørgensen JL, Léger JM, Nielsen OV, Primdahl F, Risbo T (2003) Calibration of the Ørsted vector magnetometer. Earth Planets Space 55:11. https://doi.org/10.1186/BF03352458
Olsen N, Lühr H, Sabaka TJ, Mandea M, Rother M, Tøffner-Clausen L, Choi S (2006) CHAOS—a model of the Earth’s magnetic field derived from CHAMP, Orsted, and SAC-C magnetic satellite data. Geophys J Int 166:67. https://doi.org/10.1111/j.1365-246X.2006.02959.x
Pollinger A, Ellmeier M, Magnes W, Hagen C, Baumjohann W, Leitgeb E, Lammegger R (2012) Enable the inherent omni-directionality of an absolute coupled dark state magnetometer for e.g. scientific space applications. Instrumentation and Measurement Technology Conference (I2MTC), Graz, Austria 2012
Pollinger A, Lammegger R, Magnes W, Hagen C, Ellmeier M, Jernej I, Leichtfried M, Kürbisch C, Maierhofer R, Wallner R, Fremuth G, Amtmann C, Betzler A, Delva M, Prattes G, Baumjohann W (2018) Coupled dark state magnetometer for the China Seismo-Electromagnetic Satellite. Meas Sci Technol. https://doi.org/10.1088/1361-6501/aacde4
Shen XH, Zhang XM, Yuan SG, Wang LW, Cao JB, Huang JP, Zhu XH, Piergiorgio P, Dai JP (2018) The earthquake-related disturbances in ionosphere and project of the first China seismo-electromagnetic satellite. Sci China Technol Sci 61(5):634–642. https://doi.org/10.1007/s11431-018-9242-0
Thébault E, Finlay CC, Beggan CD, Alken P, Aubert J, Barrois O, Bertrand F, Bondar T, Boness A, Brocco L, Canet E, Chambodut A, Chulliat A, Coïsson P, Civet F, Du A, Fournier A, Fratter I, Gillet N, Hamilton B, Hamoudi M, Hulot G, Jager T, Korte M, Kuang W, Lalanne X, Langlais B, Léger JM, Lesur V, Lowes FJ, Macmillan S, Mandea M, Manoj C, Maus S, Olsen N, Petrov V, Ridley V, Rother M, Sabaka J, Saturnino D, Schachtschneider R, Sirol O, Tangborn A, Thomson A, Tøffner-Clausen L, Vigneron P, Wardinski I, Zvereva T (2015) International geomagnetic reference field: the 12th generation. Earth Planets Space 67:79. https://doi.org/10.1186/s40623-015-0228-9
Xiao Q, Geng X, Cheng J, Meng LF, Li N, Zhang Y (2018) Calibration methods of the interference magnetic field for Low Earth Orbit (LEO) magnetic satellite. Chin J Geophys 61:3134. https://doi.org/10.6038/cjg2018L0408
Zhou B, Cheng BJ (2018) Development and calibration of high-precision magnetometer of the China Seismo-Electromagnetic satellite. J Remote Sens (s1):64. https://doi.org/10.11834/jrs.20187242
Zhou B, Zhao H, Wang JD, Chen SW, Liao HZ, Zhu GW, Wang C, Zhang X, Li L, Sun YQ, Feng YY, Zhou JX, Tao R (2009) Martian space environment magnetic field investigation——high accuracy magnetometer. Chin J Space Sci 29:467. https://doi.org/10.11728/cjss2009.05.467
Zhou B, Cheng BJ, Zhang YT, Zhang ZQ, Wang JD, Li L (2014) Magnetic field detection method of china seismo-electromagnetic satellite. Chin J Space Sci 34:843. https://doi.org/10.11728/cjss2014.06.843
Zhou B, Yang YY, Zhang YT, Gou XC, Cheng BJ, Wang JD, Li L (2018) Magnetic field data processing methods of the China Seismo-Electromagnetic Satellite. Earth Planet Phys 2:455. https://doi.org/10.26464/epp2018043
Acknowledgements
The authors gratefully acknowledge support from Space Research Institute of the Austrian Academy of Sciences and the Institute of Experimental Physics of the Graz University of Technology, who developed the CDSM with perfect performance in-orbit. They also acknowledge support from ESA SWARM team for continuity discussion on in-orbit data analysis. And this research made use of the data from CSES mission, a project funded by China National Space Administration (CNSA) and China Earthquake Administration (CEA).
Funding
This article is supported by National Key Research and Development Program of China from Ministry of Science and Technology of the People´s Republic of China (MOST) (2018YFC1503501) and (2016YBF0501503).
Author information
Authors and Affiliations
Contributions
BZ and XG carried out the data analysis. BC drafted the manuscript. LL, YZ, and JW have contributed to the analysis of the FGM data. WM, RL, AP, and ME have contributed to the analysis of CDSM data. QX, XZ, and SY have contributed to the satellite magnetic interference calibration. YY and XS have contributed to data analysis. All authors read and approved the final manuscript.
Corresponding authors
Ethics declarations
Competing interests
The authors declare that they have no competing interests.
Additional information
Publisher's Note
Springer Nature remains neutral with regard to jurisdictional claims in published maps and institutional affiliations.
Rights and permissions
Open Access This article is distributed under the terms of the Creative Commons Attribution 4.0 International License (http://creativecommons.org/licenses/by/4.0/), which permits unrestricted use, distribution, and reproduction in any medium, provided you give appropriate credit to the original author(s) and the source, provide a link to the Creative Commons license, and indicate if changes were made.
About this article

Cite this article
Zhou, B., Cheng, B., Gou, X. et al. First in-orbit results of the vector magnetic field measurement of the High Precision Magnetometer onboard the China Seismo-Electromagnetic Satellite. Earth Planets Space 71, 119 (2019). https://doi.org/10.1186/s40623-019-1098-3
Received:
Accepted:
Published:
DOI: https://doi.org/10.1186/s40623-019-1098-3