- Full paper
- Open access
- Published:
Solar activity dependence of medium-scale traveling ionospheric disturbances using GPS receivers in Japan
Earth, Planets and Space volume 73, Article number: 22 (2021)
Abstract
In order to reveal solar activity dependence of the medium-scale traveling ionospheric disturbances (MSTIDs) at midlatitudes, total electron content (TEC) data obtained from a Global Positioning System (GPS) receiver network in Japan during 22 years from 1998 to 2019 were analyzed. We have calculated the detrended TEC by subtracting the 1-h running average from the original TEC data for each satellite and receiver pair, and made two-dimensional TEC maps of the detrended TEC with a spatial resolution of 0.15° × 0.15° in longitude and latitude. We have investigated MSTID activity, defined as \(\delta I/\overline{I}\), where \(\delta I\) and \(\overline{I}\) are standard deviation of the detrended TEC and the average vertical TEC within the area of 133.0°–137.0° E and 33.0°–37.0° N for 1 h, respectively. From each 2-h time series of the detrended TEC data within the same area as the MSTID activity, auto-correlation functions (ACFs) of the detrended TEC were calculated to estimate the horizontal propagation velocity and direction of the MSTIDs. Statistical results of the MSTID activity and propagation direction of MSTIDs were consistent with previous studies and support the idea that daytime MSTIDs could be caused by atmospheric gravity waves, and that nighttime MSTIDs were caused by electro-dynamical forces, such as the Perkins instability. From the current long-term observations, we have found that the nighttime MSTID activity and occurrence rate increased with decreasing solar activity. For the daytime MSTID, the occurrence rate increased with decreasing solar activity, whereas the MSTID activity did not show distinct solar activity dependence. These results suggest that the secondary gravity waves generated by dissipation of the primary gravity waves propagating from below increase under low solar activity conditions. The mean horizontal phase velocity of the MSTIDs during nighttime did not show a distinct solar activity dependence, whereas that during daytime showed an anticorrelation with solar activity. The horizontal phase velocity of the daytime MSTIDs was widely distributed from 40 to 180 m/s under high solar activity conditions, whereas it ranged between 80 and 200 m/s, with a maximum occurrence at 130 m/s under low solar activity conditions, suggesting that gravity waves with low phase velocity could be dissipated by high viscosity in the thermosphere under low solar activity conditions.

Introduction
In the Earth’s ionosphere, various types of disturbances of the plasma density exist. Traveling ionospheric disturbance (TID) is one of them, and is defined as wave-like phenomenon of the plasma density in the ionosphere. According to Hunsucker (1982), medium-scale TID (MSTID) is defined as a TID with horizontal wavelengths of approximately hundreds of kilometers, and periods ranging from 15 min to 1 h. Since Hines (1960), MSTIDs have been considered to be caused by atmospheric gravity waves (GWs) propagating in the thermosphere, and thus, a manifestation of the GWs. Although various techniques have been used to observe MSTIDs, most of the observations of the MSTIDs until the late 1990s were carried out at a single or a few points on the ground using ionosondes, high frequency (HF) radars, incoherent scatter radars, and beacon radio waves from satellites along the satellite paths (e.g., DuCastel and Faynot 1964; Morgan et al. 1978; Bristow and Greenwald 1995; Jacobson et al. 1995; Hocke et al. 1996; Oliver et al. 1997). Since the late 1990s, Global Positioning System (GPS) receiver networks and all-sky airglow imagers have made it possible to observe two-dimensional horizontal structures of the MSTIDs (e.g., Saito et al. 1998; Mendillo et al. 1997). As a result, a distinct difference in the MSTID propagation direction between daytime and nighttime has been revealed, suggesting that MSTIDs are generated by different mechanisms between daytime and nighttime (e.g., Miller et al. 1997; Kotake et al. 2007).
Since the nighttime MSTIDs propagated southwestward in the northern hemisphere and northwestward in the southern hemisphere (e.g., Shiokawa et al. 2003a; Martinis et al. 2011), the Perkins instability (Perkins 1973) was considered to be a cause of the nighttime MSTIDs. Electric field perturbations associated with the nighttime MSTIDs have also been observed (Shiokawa et al. 2003b). Based on these results, such this type of MSTID was named electrified MSTID (EMSTID) to differentiate from MSTIDs that could be caused by GWs (Narayanan et al. 2018).
Over Japan, Saito et al. (1998), for the first time, showed two-dimensional maps of TEC obtained from a dense GPS-receiver network in Japan for the first time. Otsuka et al. (2011) have analyzed the GPS-TEC data from one year in Japan, and showed seasonal and local time variations of MSTIDs. Using two-dimensional TEC map data obtained from Global Navigation Satellite System (GNSS) receiver networks, local time and seasonal variations of MSTIDs over South California (Kotake et al. 2007), Europe (Otsuka et al. 2013), Brazil (Figueiredo et al. 2018), and China (Ding et al. 2011) have been clarified statistically. However, the solar activity dependence of the MSTID characteristics has not been studied well. In this study, we have investigated MSTID characteristics statistically by analyzing 22 years of two-dimensional data of GPS-TEC over Japan, from 1998 to 2019. Based on the statistical results, we will discuss possible causes of the solar activity dependence of MSTIDs at midlatitudes.
Data and analysis method
Approximately 1300 dual-frequency (1.57542 GHz and 1.22760 GHz) GPS receivers have been installed in Japan by the Geospatial Information Authority of Japan as the GNSS Earth Observation Network System (GEONET) as of 2020. These GPS receivers provide carrier phase delays and group delays (C/A and/or P-code pseudoranges) of dual-frequency GPS signals every 30 s. The TEC along the ray path of the radio wave between the GPS satellite and receiver was accurately obtained from the carrier phase data. The ambiguity in the phase measurements due to the unknown initialization constant was corrected by the TEC obtained from the corresponding pseudorange data. The inter-frequency biases included in the TEC obtained from the above procedure were subtracted by using the method by Otsuka et al. (2002) to obtain absolute TEC. In this method, a weighted least-squares fitting was used.
TEC perturbations caused by MSTIDs were obtained by subtracting the 1-h running average (average over ± 30 min centered on the corresponding data) from the original TEC time series for each pair of satellites and receivers (Saito et al. 1998). TEC data with elevation angles larger than 35° were used in this study. The slant TEC was converted to vertical TEC by multiplying a slant factor defined as \(\tau_{0} /\tau_{1}\), where \(\tau_{1}\) is the length of the ray path between 250 and 450 km altitudes, and \(\tau_{0}\) is the thickness of the ionosphere (200 km) for the zenith path. TEC was mapped on the ionospheric shell at an altitude of 300 km with a horizontal cell of 0.15° × 0.15° in latitude and longitude. The TEC data within each horizontal cell were then averaged. This high spatial resolution made it possible to detect the MSTID structure in the detrended TEC map. Figure 1 shows a two-dimensional map of detrended TEC over Japan at 15:00 UT (24:00 LT) on 8 June 2019. Wavefronts of the detrended TEC, elongating from northwest to southeast, can be seen. The method for deriving two-dimensional TEC maps was described in detail by Saito et al. (1998).

Two-dimensional map of detrended TEC at 15:00 UT on 8 June (00:00 LT on 9 June) 2019. TEC data within an area enclosed by solid lines (133.0°–137.0° E and 33.0°–37.0° N) were used to estimate MSTID activity and horizontal propagation direction and velocity of MSTIDs
We have investigated the long-term variation of MSTID activity, defined as \(\delta I/\overline{I}\), where \(\delta I\) and \(\overline{I}\) are the standard deviation of the detrended TEC and mean vertical TEC within an area of 133.0°–137.0° E and 33.0°–37.0° N during one hour, respectively, using the same method as Otsuka et al. (2008). The area used for the calculation of \(\delta I\) and \(\overline{I}\) is enclosed by the black lines in Fig. 1.
In this study, we have newly developed an automated method to estimate the horizontal propagation direction and velocity of MSTIDs. First, we have calculated three-dimensional auto-correlation functions (ACFs) from 2-h time series of detrended TEC map data every 5 min within an area of 133.0°–137.0° E and 33.0°–37.0° N, which was the same as that for the estimation of the MSTID activity. Since MSTIDs observed with GPS-TEC in Japan have horizontal wavelengths ranging between 100 and 400 km (Otsuka et al. 2011), this area covers more than one horizontal wavelength of MSTIDs in Japan. Figure 2 shows two-dimensional ACFs as a function of lags in longitude and latitude at lag times of − 40, − 20, 0, and 20 min, respectively. In each panel, a high ACF region is found to be elongated along the northwest–southeast. This structure corresponds to the horizontal structure of TEC perturbations caused by MSTIDs with the wavefront elongating along the northwest–southeast. Maximum AFCs, which is shown by ‘ + ’ in each panel, appear at (lag number in longitude, lag number in latitude) = (5, 3), (2, 2), (0, 0), and (− 3, − 2) at the time lags of − 40, − 20, 0, and 20 min, respectively. This movement of the maximum ACF with time represents the propagation of the TEC perturbations. Latitudinal and longitudinal lag numbers of the maximum ACF at each time epoch were obtained for the lag time from − 50 to 50 min at an interval of 10 min. Figure 3 shows (a) latitudinal and (b) longitudinal lag numbers of maximum ACF at each time epoch as a function of lag time. The solid line in Fig. 3 represents a regression line of the latitudinal (longitudinal) lag number with respect to the lag time of the maximum ACF, assuming that the regression line passes the origin. To obtain the regression line, the inverse of the lag number in latitude (longitude) was used as a weighting function. In this process, the data with ACF exceeding 0.4 and MSTID activity exceeding 1% were used. The slope of the regression line represents the propagation velocity of the detrended TEC in the latitudinal and longitudinal directions, respectively. The negative slope in Fig. 3a, b indicates southward and westward propagation, respectively. Since the cell size of the TEC map was 0.15° × 0.15° in latitude and longitude, a unit lag in latitude and longitude was approximately 16.6 km and 13.7 km, respectively. In this study, the regression line was determined from more than 4 lag data points. From these slopes, zonal and meridional propagation velocity, and direction of the TEC perturbations were obtained. For the case shown in Fig. 3, the horizontal phase velocity and azimuth clockwise from due north were found to be 75.4 m/s and 239°, respectively. This method has been applied to the TEC data from 1998 to 2019. To exclude the effects of geomagnetic disturbances, the data with a Kp-index larger than 4 were excluded. We classified the obtained MSTID parameters into high and low solar activity conditions according to the solar activity index, which is the F10.7 index. The high (low) solar activity conditions were defined as F10.7 index larger than 120 (smaller than 110).

Two-dimensional auto-correlation functions (ACFs) as a function of lag numbers in longitude and latitude at different lag time of a − 40, b − 20, c 0, and d 20 min, obtained from the detrended TEC within the area of 133.0°–137.0° E and 33.0°–37.0° N (shown in Fig. 1) and during a period of 2 h between 14:00 and 16:00 UT on 8 June 2019. A maximum ACF for each lag time is shown by a symbol ‘ + ’ in the figure
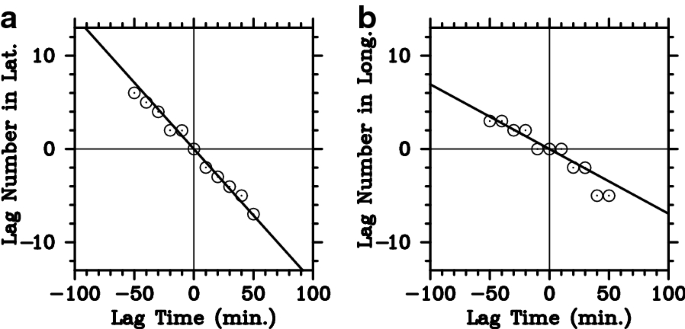
a Latitudinal and b longitudinal lag numbers of the maximum ACF at each time epoch for the time lag from − 50 to 50 min at an interval of 10 min for the detrended TEC within the area of 133.0°–137.0° E and 33.0°–37.0° N between 14:00 and 16:00 UT on 8 June 2019. Solid line in each panel represents regression line of latitudinal (longitudinal) lag number with respect to the lag time of the maximum ACF, assuming that the regression line passes the origin. To obtain the regression line, inverse of lag number in latitude (longitude) was used as a weighting function
Results
Figure 4 shows local time and seasonal variations of MSTID activity and MSTID occurrence rate under high and low solar activity conditions. The MSTID activity has been classified into monthly and hourly bin, and averaged in each bin. The MSTID occurrence rate is also classified into monthly and hourly bin. The MSTID occurrence was defined as the event that satisfies the following criteria: (1) MSTID activity was larger than 1%, and (2) horizontal propagation velocity of the TEC perturbations was determined. From the figures, both MSTID activity and MSTID occurrence rate were found to show similar local time and seasonal variations, and strongly dependent on the local time and season. Based on these statistical results, it was found that the daytime MSTID activity and occurrence rate were higher in winter than in the other seasons, and that the nighttime MSTID activity and occurrence rate displayed semiannual variation, with a primary peak in summer and a secondary peak in winter. Both MSTID activity and occurrence rate reached a peak simultaneously at 22–23 LT in nighttime summer. In nighttime winter, they were maximized at 23 LT under low solar activity conditions, and approximately 19 LT under high solar activity conditions. From the comparison between the results under high and low solar activity conditions, it was found that both MSTID activity and occurrence rate during daytime and nighttime were higher under low solar activity conditions than under high solar activity conditions. The occurrence rate of nighttime MSTID in summer was close to 100% under low solar activity condition. It was also found that the MSTID activity was higher during nighttime than during daytime.

Local time and seasonal variations of a, b MSTID activity and c, d MSTID occurrence rate averaged within an area of 133.0°–137.0° E and 33.0°–37.0° N under high and low solar activity conditions
Figure 5 shows local time and seasonal variations of horizontal propagation direction and velocity of MSTID for high and low solar activity conditions. In the figures, the data are shown only when the MSTID occurrence rate in each cell exceeded 50%. It was found that propagation direction and velocity of MSTID depended on the local time. The MSTIDs propagated southward (approximately 180° in azimuth) during daytime and southwestward (approximately 240° in azimuth) during nighttime. The propagation velocity of MSTIDs was higher during daytime than during nighttime. The propagation direction of MSTIDs during both daytime and nighttime did not show a distinct solar activity dependence. The propagation velocity of MSTID during daytime tended to be larger under low solar activity conditions than under high solar activity conditions, whereas solar activity dependence of the propagation velocity during nighttime was not discernible. At dawn (03–06 LT), when MSTID activity and occurrence rate were high, westward propagation was seen in all seasons. Since the morning terminator moves westward, the enhancement of MSTID activity and occurrence rate with the westward propagation may be an effect of rapid increase in TEC at the sunrise due to the plasma production by solar radiation. In summer, after sunrise (06–09 LT), southeastward propagation at velocities of 70–130 m/s was observed. Otsuka et al. (2011), who have investigated GPS-TEC data by visual inspection, had shown that MSTID over Japan at dawn appeared frequently in summer and propagated mostly eastward. They had suggested that the dawn MSTID could be caused by atmospheric gravity waves and that the wind filtering mechanism could be operating effectively because the dawn MSTID propagated in the opposite direction to the background neutral winds. In this study, we focused on the daytime MSTIDs, which occur during 09–15 LT (00–06 UT) on January and December, and the nighttime MSTIDs, which occur during 19–01 LT (10–15 UT) between May and August.

Local time and seasonal variations of a, b horizontal propagation direction and c, d velocity of MSTID in the area of 133.0°–137.0° E and 33.0°–37.0° N under high and low solar activity conditions. Black indicates missing data. The data are shown only when the MSTID occurrence rate in each cell exceeds 50%
Figure 6 shows the 22-year variation of (a) yearly mean F10.7 index and (b and c) MSTID activity and occurrence rate in Japan during daytime and nighttime between 1998 and 2019. Distinct solar activity dependence of the MSTID activity and occurrence rate during nighttime can be seen. The nighttime MSTID activity increased with decreasing solar activity. On the other hand, the daytime MSTID activity did not show a distinct solar activity dependence, whereas the MSTID occurrence rate during daytime displayed anticorrelation with the solar activity. Figure 6d, e shows the horizontal propagation direction and phase velocity of daytime and nighttime MSTIDs. The MSTIDs propagated southward during daytime and southwestward during nighttime. The propagation direction of the daytime MSTIDs did not depend on the solar activity, whereas that of the nighttime MSTIDs tended to be toward south of southwest during high solar activity period and west of southwest during low solar activity period. The horizontal phase velocity of daytime MSTIDs showed a distinct anticorrelation with solar activity, whereas that of nighttime MSTIDs did not. Mean phase velocity of daytime MSTIDs reached 140 m/s during low solar activity period, and was approximately 90 m/s during high solar activity period.

Twenty-two year variations of yearly mean of a solar activity index, F10.7; b MSTID activity; c MSTID occurrence rate; d and e horizontal propagation direction (azimuth clockwise from due north) and phase velocity of MSTID, respectively, between 1998 and 2019. Red and blue curves represent daytime (average over 09–15 LT between May and August) and nighttime (average over 19–01 LT on January and December) MSTIDs, respectively
The solar activity (F10.7) dependence of the daytime and nighttime MSTID activity was investigated quantitatively. In Fig. 7, the daytime and nighttime MSTID activity for each year was an average of hourly MSTID activity during the daytime (09–15 LT) in winter (January and December) and an average over nighttime (19–01 LT) in summer (between May and August), respectively. Using the least-squares method, linear regression lines for the daytime and nighttime MSTID activity as a function of F10.7, respectively, were determined. It was found that the MSTID activity (\(\delta I/\overline{I}\)) can be expressed as a function of F10.7: \(\delta I/\overline{I} = 1.77 - 0.00238{ } \times F_{10.7}\) for daytime and \(\delta I/\overline{I} = 3.33 - { }0.00646{ } \times F_{10.7}\) for nighttime. Anticorrelation of the MSTID activity with the solar activity was clearly observed for both daytime and nighttime. The nighttime MSTID activity strongly depended on the solar activity, whereas the solar activity dependence of the daytime MSTID activity was weak.
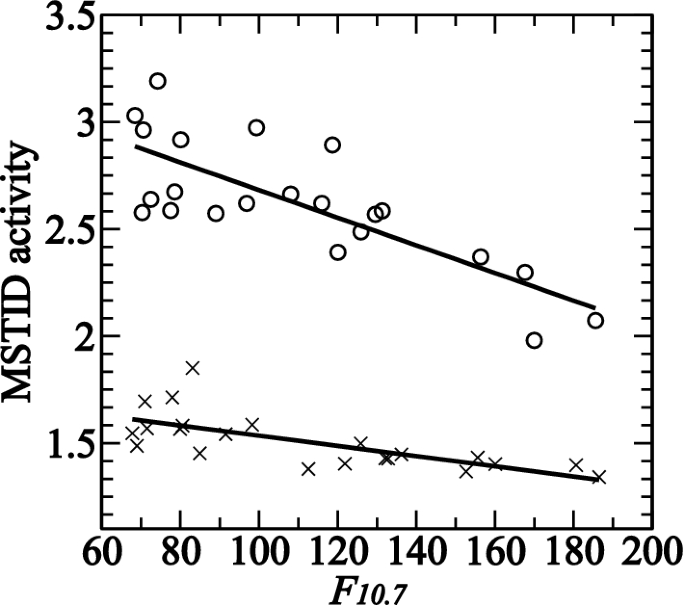
Solar activity (F10.7) dependence of the MSTID activity for daytime (cross) and nighttime (circle). The daytime and nighttime MSTID activity for each year is an average of hourly MSTID activity over daytime (09–15 LT) in winter (January and December) and average over nighttime (19–01 LT) in summer (between May and August, respectively. Solid lines represent linear regression of the daytime and nighttime MSTID activity as a function of F10.7, respectively
To investigate the solar activity dependence of the phase velocity for the daytime MSTIDs, the occurrence distribution of the phase velocity for high and low solar activity periods was investigated. Figure 8 shows the local time variation of the occurrence distribution in the horizontal phase velocity of the MSTIDs in winter (on January and December) under high solar activity conditions and under low solar activity conditions, respectively. For this study, the day on which the 81-day mean F10.7 index was larger than 120 (smaller than 100) was classified into high (low) solar activity conditions. The horizontal phase velocity data are divided into 10-m/s bins. The occurrence rate shown in Fig. 8 was obtained in each hourly and 10-m/s bin. The horizontal phase velocity of the daytime MSTIDs was distributed mainly from 40 to 180 m/s under high solar activity conditions. On the other hand, under low solar activity conditions, the occurrence rate in the phase velocity was confined between 80 and 200 m/s, with a maximum occurrence at 130 m/s. It was found that the occurrence of the higher phase velocity (100–200 m/s) was larger under low solar activity conditions than under high solar activity conditions. The occurrence of a phase velocity of ~ 50 m/s after sunset (18–24 LT) under both high and low solar activity conditions represented the occurrence of nighttime MSTID in winter.

Local time variation of horizontal phase velocity distribution of MSTIDs in winter (January and December) observed in Japan under a high and b low solar activity conditions. Occurrence rate of the phase velocity was obtained in each hourly and 10-m/s bin
Discussion
From the statistical analysis of the MSTID activity and propagation direction for MSTIDs, we found that MSTIDs frequently propagated southward during daytime, and southwestward during nighttime. This feature is consistent with previous studies (e.g., Kotake et al. 2007; Otsuka et al. 2011, 2013; Tsugawa et al. 2007). In this section, we focus on the solar activity dependnce of the MSTID activity and phase velocity.
MSTID activity
MSTIDs over Japan during the nighttime propagate mostly southwestward. The northwest–southeast alignment of the MSTID wavefront is a preferable condition for the Perkins instability (Perkins 1973). When the normal line to the wavefront of the plasma density perturbations exists between the east and the ionospheric current direction, the plasma density perturbations grow with time through the Perkins instability. Because of the southwestward preference of the nighttime MSTID propagation direction, the Perkins instability is considered to play an important role in generating the nighttime MSTIDs.
Both activity and occurrence rate of nighttime MSTID during 22 years showed clear anticorrelation with solar activity. They were high (low) for low (high) solar activity conditions. This feature was consistent with that reported by previous observations of the nighttime MSTIDs by GPS-TEC (e.g., Saito et al. 2002) and by 630.0-nm airglow images (e.g., Duly et al. 2013; Tsuchiya et al. 2018).
The anticorrelation of the MSTID activity and occurrence rate can be explained by the theory of the Perkins instability. The linear growth rate of the Perkins instability, \({\upgamma }\), is inversely proportional to \(\left\langle {\nu_{in} } \right\rangle\), where \(\left\langle {\nu_{in} } \right\rangle\) is the ion–neutral collision frequency (\(\nu_{in}\)) integrated along the geomagnetic field with a weighting function of the plasma density (Perkins 1973; Hamza 1999). Because \(\nu_{in}\) is proportional to the neutral density, \(\left\langle {\nu_{in} } \right\rangle\) increases with increasing solar activity, and thus \({\upgamma }\) shows anticorrelation with the solar activity.
At midlatitudes, the altitude of the F layer is supported by effective electric fields, \({\varvec{E}}^{*} = {\varvec{E}} + {\varvec{U}} \times {\varvec{B}}\), against the downward gravity-induced diffusion velocity \({\raise0.7ex\hbox{$g$} \!\mathord{\left/ {\vphantom {g {\left\langle \nu \right\rangle }}}\right.\kern-\nulldelimiterspace} \!\lower0.7ex\hbox{${\left\langle \nu \right\rangle }$}}\), where \({\varvec{E}}\) is the electric field, \({\varvec{U}}\) is the neutral wind, \({\varvec{B}}\) is the geomagnetic field, and \(g\) is the gravitational acceleration. Therefore, \({\upgamma }\) is also proportional to \({\varvec{E}}^{*}\). On average, \({\varvec{U}}\) does not show distinct solar activity dependence (Emmert et al. 2006), but \({\varvec{E}}\) is smaller under low solar activity conditions than under high solar activity conditions (e.g., Fejer 1993; Takami et al. 1996). \({\varvec{E}}\) is a polarization electric field driven through the F-region dynamo (Rishbeth 1971) by \({\varvec{U}}\). Through the F-region dynamo, \({\varvec{E}}\) is generated to satisfy \({\varvec{E}} + {\varvec{U}} \times {\varvec{B}} = 0\), which satisfies the divergence-free conditions of the current, so that the direction of \({\varvec{E}}\) is opposite to \({\varvec{U}} \times {\varvec{B}}\). Under high solar activity conditions, when the height-integrated Pedersen conductivity in the F region is significantly larger than that in the E region, \({\varvec{E}} + {\varvec{U}} \times {\varvec{B}}\) is nearly equal to zero. On the other hand, under low solar activity conditions, the height-integrated Pedersen conductivity in the F region is comparable to that in the E region so that \(\left| {\varvec{E}} \right|\) is smaller than \(\left| {{\varvec{U}} \times {\varvec{B}}} \right|\). Consequently, \({\varvec{E}}^{*} = {\varvec{E}} + {\varvec{U}} \times {\varvec{B}}\) is larger under low solar activity conditions than under high solar activity conditions, so that the growth rate \({\upgamma }\) is larger under low solar activity conditions than under high solar activity conditions. Consequently, the solar activity dependence of the growth rate for the Perkins instability is consistent with that of the observed MSTID activity.
On the other hand, for the daytime MSTID, the occurrence rate showed anticorrelation of the solar activity, whereas the solar activity dependence of MSTID activity was weak. Since most of the daytime MSTIDs propagate equatorward, the daytime MSTIDs are thought to be caused by GWs propagating in the thermosphere. The plasma in the F region moves along the geomagnetic field lines through the ion–neutral collisions because the ion motion across the geomagnetic field line is restricted owing to the ion gyrofrequency being much higher than the ion–neutral collision frequency, and the current in the F region does not produce polarization electric fields due to the high conductivity in the daytime E region. GWs propagating equatorward and upward have larger amplitudes of neutral particle oscillation, parallel to the geomagnetic field lines, and thus induce larger plasma density perturbations in the ionosphere compared with GWs propagating in other directions (Hooke 1968). This directivity of the ion motion to the neutral particle oscillation caused by GWs could be responsible for the preference of the equatorward propagation for the daytime MSTIDs.
To maintain the kinetic energy of the upward propagating GWs, the decrease in the neutral density in the thermosphere causes an increase in the amplitude of the GWs. Bowman (1992) have suggested that the amplified GWs may be responsible for spread F, which is also a plasma density disturbance in the ionosphere. Due to this effect, the MSITD activity could increase with decreasing solar activity. However, the daytime MSTID activity obtained in this study did not show distinct solar activity dependence, suggesting that the daytime MSTID over Japan could not be caused by GWs propagating from the lower atmosphere directly. Vadas (2007) has shown that the effect of viscosity on the GWs increases with decreasing solar activity because the neutral density decreases with decreasing solar activity. Because the viscosity of the neutral atmosphere reduces amplitude of GWs, the MSTID activity could be suppressed under low solar activity conditions. The combination of these opposite effects may cause indistinct solar activity dependence of the daytime MSTID activity. On the other hand, owing to the high viscosity, GWs may dissipate and create horizontal body forces by deopsiting momentum into the background atmosphere, such that secondary GWs may be generated (Vadas and Liu 2009). The seocndary GWs could be generated frequently under low solar activity conditions because of the low neutral density. High occurrence of the secondary GWs under low solar activity conditoins may be responsible for the anticorrelation of the daytime MSTID occurrence rate with solar activity.
Phase velocity of MSTIDs
Daytime MSTID was found to occur most frequently in winter. This feature was consistent with MSTIDs in different regions (e.g., Kotake et al. 2006; Otsuka et al. 2011). Miyoshi et al. (2018) successfully reproduced MSTIDs generated by upward propagating GWs that are spontaneously generated in the global atmosphere–ionosphere coupled model, and showed that the daytime MSTID was more active in winter than in summer. According to the dispersion relation for GW, the vertical wave number (\(m\)) of GW is expressed as
where \(k\) and \(c\) are the horizontal wave number and horizontal phase speed of the gravity wave, respectively, \(N\) is the Brunt–Väisälä frequency, and \(H\) is the scale height of the neutral atmosphere. Background neutral wind (\(U\)) also affects the vertical wave number (\(m\)). From the dispersion relation, it was found that \(m\) was larger when \(\left( {c - U} \right)^{2}\) was smaller.
Neutral winds in the thermosphere are produced due to a balance between the pressure gradient force and ion drag. The pressure gradient forces are caused by the solar extreme ultraviolet (EUV) heating of the thermosphere. Therefore, the neutral winds in the thermosphere blow poleward during daytime and equatorward during nighttime. Regarding seasonal variation of the neutral winds in the thermosphere, the winds blow from the summer hemisphere to the winter hemisphere because the thermospheric temperature is higher in summer hemisphere than in winter hemisphere due to the difference in the solar zenith angle between summer and winter hemispheres. Consequently, the thermospheric winds during the daytime blow poleward, and are larger in winter than in summer. Such a feature can be seen in the seasonal variation of the thermospheric winds measured by the Middle and Upper atmosphere (MU) radar in Japan (Kawamura et al. 2000). For the GWs propagating equatorward, the background winds blow in the direction opposite to the GW propagation, and are larger in winter than in summer. Therefore, \(\left( {c - U} \right)^{2}\) is larger in winter than in summer. According to the dispersion relationship for GW, the vertical wave number is expected to be larger in summer than in winter, and hence, the vertical wavelength could be larger in winter than in summer. Due to the high viscosity and thermal conductivity in the thermosphere, GWs in the thermosphere are dissipated (Pitteway and Hines 1963). In particular, the GWs with shorter vertical wavelengths could likely be attenuated and dissipated, but the GWs with longer wavelengths could propagate for long distances while maintaining the amplitude of the oscillation. Considering the dissipation of GWs, it is expected that the GWs in the thermosphere could be attenuated in summer because the vertical wavelength is shorter, and could propagate for long distances in winter. This scenario can explain our statistical result, which shows that the daytime MSTIDs occur most frequently in winter.
Regarding solar activity dependence, our results showed that the average phase velocity of the daytime MSTIDs was larger under low solar activity conditions than under high solar activity conditions. This dependence of the phase velocity on solar activity is attributed to the dependence of distribution of the phase velocity occurrence rate on solar activity. Under high solar activity conditions, the phase velocities of daytime MSTID are distributed widely between 20 and 200 m/s, and their maximum occurrence is at 130 m/s. On the other hand, under low solar activity conditions, the phase velocities tend to be confined to a range between 100 and 200 m/s. The occurrence rate of the phase velocity between 20 and 100 m/s is lower under low solar activity conditions than under high solar activity conditions. The low occurrence rate of low phase velocity of daytime MSTIDs in the low solar activity could be explained in terms of the dissipation of GWs in the low solar activity. According to the dispersion relation for GW, the GWs with slow phase velocity (small c in Eq. (1)) could have larger vertical wave number (m) or shorter vertical wavelength. The GWs with short vertical wavelengths are likely to dissipate, and only GWs with longer vertical wavelengths could survive in the thermosphere. Because viscosity is larger when the neutral density is small, the dissipation of GWs due to viscosity could occur under low solar activity conditions (Vadas 2007). Our results suggest that under low solar activity conditions, GWs with slow phase velocity tend to be attenuated in the thermosphere, and the daytime MSTIDs are mostly caused by GWs with higher phase velocity although the daytime MSTIDs under high solar activity are caused by GWs with various phase velocities up to approximately 200 m/s. From Fig. 8, it can be seen that the occurrence rate of the higher phase velocity (100–200 m/s) increases with decreasing solar activity. This may be caused by an increase in the secondary GWs generated by dissipation of the primary GWs in the thermosphere, where the neutral density is low under low solar activity conditions, as discussed in the previous subsection.
Since GWs in the thermosphere are considered to propagate from the lower atmosphere, seasonal variation of GW activity in the thermosphere may be affected by that of GWs in the lower atmosphere. Murayama et al. (1994) reported annual variation of the GWs in the lower stratosphere, observed by the MU radar in Japan, and showed that GW kinetic energy is maximized in winter. They have suggested that the GW kinetic energy in the stratosphere over Japan is high when the subtropical jet stream at approximately 12-km altitude is strong. Satellite observations have revealed the global distribution of the GW activity in the stratosphere (Tsuda et al. 2000; Jiang et al. 2004), and have shown that the GW activity is highest in winter in both northern and southern hemispheres. Using the Atmospheric Infrared Sounder (AIRS) aboard NASA's Aqua satellite, Hoffmann et al. (2013), who have investigated the global distribution of hotspots of stratospheric GWs, have shown that most of the hotspots were related to the orographic GWs. High GW activity in the stratosphere in winter may be related to the high GW activity in the thermosphere, resulting in high MSTID activity during the daytime in winter. However, using the MU radar in Japan, Tsuda et al. (1990) reported that seasonal variation of GW kinetic energy in the mesosphere (65–85 km) showed maxima in both summer and winter, and minima during equinox. Further study of the vertical propagation of GWs from the lower atmosphere to the thermosphere may be needed to understand the underlying mechanisms for seasonal variation of the GWs in the thermosphere and daytime MSTIDs.
Conclusions
We have analyzed GPS-TEC data in Japan during 22 years from 1998 to 2019 to investigate the solar activity dependence of MSTID over Japan. Statistical results of the MSTID activity, MSTID occurrence rate, and propagation direction of the MSTIDs were consistent with the previous studies, suggesting that daytime MSTIDs could be caused by GWs, and that nighttime MSTIDs could be caused by the Perkins instability. The findings obtained in this study, based on the current long-term observations, are summarized as follows:
-
1.
The MSTID activity defined as \(\delta I/\overline{I}\), where \(\delta I\) and \(\overline{I}\) are the standard deviation of the detrended TEC and average vertical TEC during 1 h, respectively, and the occurrence rate of the nighttime MSTID increases with decreasing solar activity. This feature was consistent with that of the growth rate for the Perkins instability.
-
2.
The occurrence rate of the daytime MSTID showed an anticorrelation with the solar activity, whereas the MSTID activity during daytime did not show distinct solar activity dependence. This result suggests that the daytime MSTID over Japan mostly could not be caused by GWs propagating from the lower atmosphere directly, but that the increase in the secondary GWs generated by dissipation of the primary GWs propagating from below, under low solar activity conditions, may contribute to the anticorrelation of daytime MSTID occurrence rate with solar activity.
-
3.
The horizontal phase velocity of the nighttime MSITD did not distinctively depend on the solar activity. On the other hand, the mean horizontal phase velocity of the MSTIDs during daytime showed an anticorrelation with solar activity. The horizontal phase velocity of the daytime MSTIDs was widely distributed from 40 to 180 m/s widely, whereas it was confined to a range between 80 and 200 m/s with a maximum occurrence at 130 m/s under low solar activity conditions. This result suggests that GWs with low phase velocity could be dissipated by high viscosity in the thermosphere under low solar activity conditions.
Availability of data and materials
The GPS-TEC data are available at DRAWING-TEC (https://aer-nc-web.nict.go.jp/GPS/DRAWING-TEC/).
Abbreviations
- ACF:
-
Auto-correlation function
- EMSTID:
-
Electrified medium-scale traveling ionospheric disturbance
- EUV:
-
Extreme ultraviolet
- GEONET:
-
GNSS Earth Observation Network System
- GNSS:
-
Global Navigation Satellite System
- GPS:
-
Global Positioning System
- GW:
-
Gravity wave
- HF:
-
High frequency
- MSTID:
-
Medium-scale traveling ionospheric disturbance
- TEC:
-
Total electron content
- TID:
-
Traveling ionospheric disturbance
References
Bowman GG (1992) Upper atmosphere neutral-particle density variations compared with spread-F occurrence rates at locations around the world. Ann Geophys 10:676–682
Bristow WA, Greenwald RA (1995) Estimating gravity wave parameters from oblique high-frequency backscatter: modeling and analysis. J Geophys Res 100(A3):3639–3648
Ding F, Wan W, Xu G, Yu T, Yang G, Wang J (2011) Climatology of medium-scale traveling ionospheric disturbances observed by a GPS network in central China. J Geophys Res. https://doi.org/10.1029/2011JA016545
DuCastel F, Faynot JM (1964) Some irregularities observed simultaneously in the upper and lower ionosphere at middle latitudes. Nature 204:984
Duly TM, Chapagain NP, Makela JJ (2013) Climatology of nighttime medium-scale traveling ionospheric disturbances (MSTIDs) in the Central Pacific and South American sectors. Ann Geophys 31(12):2229–2237. https://doi.org/10.5194/angeo-31-2229-2013
Emmert JT, Faivre ML, Hernandez G, Jarvis MJ, Meriwether JW, Niciejewski RJ, Sipler DP, Tepley CA (2006) Climatologies of nighttime upper thermospheric winds measured by ground-based Fabry-Perot interferometers during geomagnetically quiet conditions: 1. Local time, latitudinal, seasonal, and solar cycle dependence. J Geophys Res. https://doi.org/10.1029/2006JA011948
Fejer BG (1993) F region plasma drifts over Arecibo: Solar cycle, seasonal, and magnetic activity effects. J Geophys Res 98(A8):13645–13652
Figueiredo CAOB, Takahashi H, Wrasse CM, Otsuka Y, Shiokawa K, Barros D (2018) Medium-scale traveling ionospheric disturbances observed by detrended total electron content maps over Brazil. J Geophys Res Space Phys 123:2215–2227. https://doi.org/10.1002/2017JA025021
Hamza AM (1999) Perkins instability revisited. J Geophys Res 104:22567–22575
Hines CO (1960) Internal atmospheric gravity waves at ionospheric heights. Can J Phys 38:1441–1481
Hocke K, Schlegel K, Kirchengast G (1996) Phases and amplitudes of TIDs in the high latitude F-region observed by EISCAT. J Atmos Terr Phys 58:245–255. https://doi.org/10.1016/0021-9169(95)00033-X
Hoffmann L, Xue X, Alexander MJ (2013) A global view of stratospheric gravity wave hotspots located with Atmospheric Infrared Sounder observations. J Geophys Res Atmos 118:416–434. https://doi.org/10.1029/2012JD018658
Hooke WH (1968) Ionospheric irregularities produced by internal atmospheric gravity waves. J Atmos Terr Phys 30:795–823
Hunsucker RD (1982) Atmospheric gravity waves generated in the high-latitude ionosphere: a review. Rev Geophys 20(2):293–315. https://doi.org/10.1029/RG020i002p00293
Jacobson AR, Carlos RC, Massey RS, Wu G (1995) Observation of traveling ionospheric disturbances with a satellite-beacon radio interferometer: seasonal and local time behavior. J Geophys Res 100(A2):1653–1665. https://doi.org/10.1029/94JA02663
Jiang JH, Wang B, Goya K, Hocke K, Eckermann SD, Ma J, Wu DL, Read WJ (2004) Geographical distribution and interseasonal variability of tropical deep convection: UARS MLS observations and analyses. J Geophys Res 109:D03111. https://doi.org/10.1029/2003JD003756
Kawamura S, Otsuka Y, Zhang SR, Fukao S, Oliver WL (2000) A climatology of middle and upper atmosphere radar observations of thermospheric winds. J Geophys Res 105(A6):12777–12788. https://doi.org/10.1029/2000JA900013
Kotake N, Otsuka Y, Tsugawa T, Ogawa T, Saito A (2006) Climatological study of GPS total electron content variations caused by medium-scale traveling ionospheric disturbances. J Geophys Res. https://doi.org/10.1029/2005JA011418
Kotake N, Otsuka Y, Tsugawa T, Ogawa T, Saito A (2007) Statistical study of medium-scale traveling ionospheric disturbances observed with the GPS networks in Southern California. Earth Planets Space 59:95–102. https://doi.org/10.1186/BF03352681
Martinis C, Baumgardner J, Wroten J, Mendillo M (2011) All-sky imaging observations of conjugate medium-scale traveling ionospheric disturbances in the American sector. J Geophys Res. https://doi.org/10.1029/2010JA016264
Mendillo M, Baumgardner J, Nottingham D, Aarons J, Reinisch B, Scali J, Kelley M (1997) Investigations of thermospheric-ionospheric dynamics with 6300 a images from the Arecibo Observatory. J Geophys Res 102:7331–7343
Miller CA, Swartz WE, Kelley MC, Mendillo M, Nottingham D, Scali J, Reinisch B (1997) Electrodynamics of midlatitude spread F, 1. Observations of unstable, gravity wave-induced ionospheric electric fields at tropical latitudes. J Geophys Res 102:11521–11532
Miyoshi Y, Jin H, Fujiwara H, Shinagawa H (2018) Numerical study of traveling ionospheric disturbances generated by an upward propagating gravity wave. J Geophys Res Space Phys 123:2141–2155. https://doi.org/10.1002/2017JA025110
Morgan MG, Calderón CHJ, Ballard KA (1978) Techniques for the study of TIDs with multi-station rapid-run ionosondes. Radio Sci 13:729–741. https://doi.org/10.1029/RS013i004p00729
Murayama Y, Tsuda T, Kato S, Fukao S (1994) Seasonal variation of gravity wave activity in the lower stratosphere observed with the MU radar. J Geophys Res 99:23057–23069
Narayanan VL, Shiokawa K, Otsuka Y, Neudegg D (2018) On the role of thermospheric winds and sporadic E layers in the formation and evolution of electrified MSTIDs in geomagnetic conjugate regions. J Geophys Res Space Phys. https://doi.org/10.1029/2018JA025261
Oliver WL, Otsuka Y, Sato M, Takami T, Fukao S (1997) A climatology of F region gravity wave propagation over the middle and upper atmosphere radar. J Geophys Res 102(A7):14499–14512. https://doi.org/10.1029/97JA00491
Otsuka Y, Ogawa T, Saito A, Tsugawa T, Fukao S, Miyazaki S (2002) A new technique for mapping of total electron content using GPS network in Japan. Earth Planets Space 54:63–70. https://doi.org/10.1186/BF03352422
Otsuka Y, Tani T, Tsugawa T, Ogawa T (2008) Statistical study of relationship between medium-scale traveling ionospheric disturbance and sporadic E layer activities in summer night over Japan. J Atmos Solar-Terr Phys 70:2196–2202
Otsuka Y, Kotake N, Shiokawa K, Ogawa T, Tsugawa T, Saito A (2011) Statistical study of medium-scale traveling ionospheric disturbances observed with a GPS receiver network in Japan. In: Abdu M, Pancheva D, Bhattacharyya A (eds) Aeronomy of the Earth’s atmosphere and ionosphere. Springer, Netherlands
Otsuka Y, Suzuki K, Nakagawa S, Nishioka M, Shiokawa K, Tsugawa T (2013) GPS observations of medium-scale traveling ionospheric disturbances over Europe. Ann Geophys 31(2):163–172. https://doi.org/10.5194/angeo-31-163-2013
Perkins F (1973) Spread F and ionospheric currents. J Geophys Res 78:218–226
Pitteway MLV, Hines CO (1963) The viscous damping of atmospheric gravity waves. Can J Phys 41:1935–1948
Rishbeth H (1971) The F-layer dynamo. Planet Space Sci 19(2):263–267. https://doi.org/10.1016/0032-0633(71)90205-4
Saito A, Miyazaki S, Fukao S (1998) High resolution mapping of TEC perturbations with the GSI GPS network over Japan. Geophys Res Lett 25:3079–3082
Saito A, Nishimura M, Yamamoto M, Fukao S, Tsugawa T, Otsuka Y, Miyazaki S, Kelley MC (2002) Observations of traveling ionospheric disturbances and 3-m scale irregularities in the nighttime F-region ionosphere with the MU radar and a GPS network. Earth Planets Space 54:31–44. https://doi.org/10.1186/BF03352419
Shiokawa K, Ihara C, Otsuka Y, Ogawa T (2003a) Statistical study of nighttime medium-scale traveling ionospheric disturbances using midlatitude airglow imagers. J Geophys Res 108(A1):1052. https://doi.org/10.1029/2002JA009491
Shiokawa K, Otsuka Y, Ihara C, Ogawa T, Rich FJ (2003b) Ground and satellite observations of nighttime medium-scale traveling ionospheric disturbance at midlatitude. J Geophys Res 108(A4):1145. https://doi.org/10.1029/2002JA009639
Takami T, Oliver WL, Richmond AD, Fukao S (1996) Ionospheric drift similarities at magnetic conjugate and nonconjugate locations. J Geophys Res 101(A7):15773–15782. https://doi.org/10.1029/96JA01316
Tsuchiya S, Shiokawa K, Fujinami H, Otsuka Y, Nakamura T, Yamamoto M (2018) Statistical analysis of the phase velocity distribution of mesospheric and ionospheric waves observed in airglow images over a 16-year period: Comparison between Rikubetsu and Shigaraki. Japan J Geophys Res Space Phys. https://doi.org/10.1029/2018JA025585
Tsuda T, Murayama Y, Yamamoto M, Kato S, Fukao S (1990) Seasonal variation of momentum flux in the mesosphere observed with the MU radar. Geophys Res Lett 17:725–728. https://doi.org/10.1029/GL017i006p00725
Tsuda T, Nishida M, Rocken C, Ware RH (2000) A global morphology of gravity wave activity in the stratosphere revealed by the GPS occultation data (GPS/MET). J Geophys Res 105:7257–7273. https://doi.org/10.1029/1999JD901005
Tsugawa T, Kotake N, Otsuka Y, Saito A (2007) Medium-scale traveling ionospheric disturbances observed by GPS receiver network in Japan: a short review. GPS Solut 11:139–144. https://doi.org/10.1007/s10291-006-0045-5
Vadas SL (2007) Horizontal and vertical propagation and dissipation of gravity waves in the thermosphere from lower atmospheric and thermospheric sources. J Geophys Res. https://doi.org/10.1029/2006JA011845
Vadas SL, Liu H (2009) Generation of large-scale gravity waves and neutral winds in the thermosphere from the dissipation of convectively generated gravity waves. J Geophys Res. https://doi.org/10.1029/2009JA014108
Acknowledgements
The GPS data in Japan were provided by The Geospatial Information Authority of Japan. The GPS-TEC data are archived by the National Institute of Information and Communications Technology, Japan. Geomagnetic and solar activity indices were obtained from the GSFC/SPDF OMNIWeb (https://omniweb.gsfc.nasa.gov).
Funding
The present study was supported by the Japan Society for the Promotion of Science, KAKENHI (15H05815, 16H06286), Project for Solar-Terrestrial Environment Prediction (PSTEP) and Study of dynamical variation of particles and waves in the inner magnetosphere using ground-based network observations (PWING).
Author information
Authors and Affiliations
Contributions
YO designed the study, performed the data analysis, and prepared the manuscript. AS developed the GPS-TEC database. TT and MN processed the GPS data, and provided GPS-TEC data. All authors read and approved the final manuscript.
Corresponding author
Ethics declarations
Ethics approval and consent to participate
Not applicable.
Consent for publication
Not applicable.
Competing interests
The authors declare that they have no competing interests.
Additional information
Publisher's Note
Springer Nature remains neutral with regard to jurisdictional claims in published maps and institutional affiliations.
Rights and permissions
Open Access This article is licensed under a Creative Commons Attribution 4.0 International License, which permits use, sharing, adaptation, distribution and reproduction in any medium or format, as long as you give appropriate credit to the original author(s) and the source, provide a link to the Creative Commons licence, and indicate if changes were made. The images or other third party material in this article are included in the article's Creative Commons licence, unless indicated otherwise in a credit line to the material. If material is not included in the article's Creative Commons licence and your intended use is not permitted by statutory regulation or exceeds the permitted use, you will need to obtain permission directly from the copyright holder. To view a copy of this licence, visit http://creativecommons.org/licenses/by/4.0/.
About this article

Cite this article
Otsuka, Y., Shinbori, A., Tsugawa, T. et al. Solar activity dependence of medium-scale traveling ionospheric disturbances using GPS receivers in Japan. Earth Planets Space 73, 22 (2021). https://doi.org/10.1186/s40623-020-01353-5
Received:
Accepted:
Published:
DOI: https://doi.org/10.1186/s40623-020-01353-5