Earthquake Forecast Testing Experiment in Japan (II)
- Article
- Open access
- Published:
Next-day earthquake forecasts for the Japan region generated by the ETAS model
Earth, Planets and Space volume 63, pages 207–216 (2011)
Abstract
This paper gives the technical solutions of implementing the space-time epidemic-type aftershock sequence (ETAS) model for short-term (1-day) earthquake forecasts for the all-Japan region in the Collaboratory for the Study of Earthquake Predictability (CSEP) project in Japan. For illustration, a retrospective forecasting experiment is carried out to forecast the seismicity in the Japan region before and after the Tokachi-Oki earthquake (M 8.0) at 19:50:07 (UTC) on 25 September 2003, in the format of contour images. The optimal model parameters used for the forecasts are estimated by fitting the model to the observation records up to the starting time of the forecasting period, and the probabilities of earthquake occurrences are obtained through simulations. To tackle the difficulty of heavy computations in fitting a complicated point-process to a huge dataset, an “off-line optimization” and “online forecasting” scheme is proposed to keep both the estimates of model parameters and forecasts updated according to the most recent observations. The results show that the forecasts have captured the spatial distribution and temporal evolution of the features of future seismicity. These forecasts are tested against the reference Poisson model that is stationary in time but spatially inhomogeneous.
1. Introduction
Statistical models for describing the occurrence process of earthquakes can be used for short-term or real-time earthquake forecasts (Vere-Jones, 1970). The principle of evaluating the probabilities of earthquake occurrence by using point process models, which are formulated with conditional intensity functions, was framed by Vere-Jones (1998). Among the different models for seismicity, the epidemic-type aftershock sequence (ETAS) model, which describes the features of earthquake clustering of fore-shocks, mainshocks, and aftershocks, has become a standard model for testing hypotheses and a starting point for short-term earthquake forecasts (see, e.g., Helmstetter and Sornette, 2003; Zhuang et al., 2004, 2008; Hainzl and Ogata, 2005; Lombardi et al., 2010).
In the study reported here, we constructed an “offline optimization and online forecast” framework for 1-day earthquake forecasts by using the space-time ETAS model, implemented in both the Collaboratory for the Study of Earthquake Predictability (CSEP) project in Japan, maintained by Earthquake Research Institute, University of Tokyo (Nanjo et al., 2011 this issue), and the CSEP project of the Southern California Earthquake Center. Similar models and procedures were also been implemented by Helmstetter et al. (2006) and Werner et al. (2011) in their earthquake forecasting experiments. The main difference between our implementation and previous reported ones is the “off-line optimization”, which will be explained in Section 3. For illustration, a retrospective forecasting experiment for the Japan region before and after the 2003 Tokachi-Oki earthquake (MJ = 8.0) is carried out in Section 4.
2. The Forecasting Model
Our forecasting model is the ETAS model. The catalog of earthquakes is considered to be a list of earthquakes identified by their occurrence times, magnitudes, and locations. We first assume that the distribution of the magnitude m is separable from the other components, with a density function taking the form of

i.e., the probability density form of the Gutenberg-Richter law for earthquake magnitudes above a magnitude threshold mc, and ß is linked with the Gutenberg-Richter b-value by ß = b ln 10. The expected number of earthquakes in the unit space-time window centered at a time t (day) and a spatial location of a longitude x (deg) and a latitude y (deg), given the observations before t, can be written as

where µ(x, y) (unit: events/(day·deg2)) represents the spontaneous (background) seismicity rate, which is a function of spatial locations but constant over time, and ξ(t, x, y, m; ti, x i , y i , m i ) (unit: events/(day·deg2)) is the contribution to seismicity rate by the i th event occurring previously. In practice, ξ(t, x, y; t i , x i , y i , m i ) is assumed separable and dependent on the differences in time and spatial locations to the initiating event, or explicitly,

where

(unit: events) is the expectation of the number of children (productivity) spawned by an event of magnitude m;

(unit: day-1) is the probability density function (p.d.f.) of the length of the time interval between a child and its parent; and

(unit: deg-2) is the p.d.f. of the relative locations between the parent and children. In the above formulations, A, α, c, p, D, q, and γ are constant parameters to be estimated from model fitting.
It is easy to see that such a model is a branching process with immigrants: the background (immigrant) process is a Poisson process; once an event occurs, irrespective of whether it is from the background processes or triggered by a previous event, this earthquake triggers a non-stationary Poisson process, specified by Eq. (3) as its children process. This model is also a kind of self-excitation process (Hawkes, 1971a, b).
The above formulations are according to Zhuang et al. (2005) and Ogata and Zhuang (2006), which are improved versions of the ones in Ogata (1998). Many other forms can also be found in the studies carried out during last 20 years (see, e.g., Console et al., 2003; Helmstetter et al., 2003).
For an observation of the process, recorded as a list in the form of {(t i , x i , y i , m i ) : i = 1, · · ·, N}, from a spatial region S and a time interval [0, T], the likelihood has the standard form (see, e.g., Daley and Vere-Jones, 2003)

If the background seismicity rate µ(x, y) is known, the model parameters, θ = (A, α, c, p, D, q, γ), can be estimated through maximizing the likelihood function. In computation, we use the Davidon-Fletch-Powell method to minimize – ln L (Fletcher and Powell, 1963).
Once the conditional intensity function is estimated, it provides us with a good method to estimate the probability that an event is a spontaneous event or is triggered by others (Kagan and Knopoff, 1976; Zhuang et al., 2002, 2004). Consider the contribution of the spontaneous seismicity rate at the occurrence of the i th event,

If we keep the ith event with probability f i for all the events in the process, we can realize a process with the occurrence rate of µ(x, y) (see Ogata (1981), or Zhuang (2006), for justification). Thus it is natural to regard f i as the probability that the i th event is a spontaneous event.
3. Model Estimation
To use the model specified by Eq. (2) to forecast seismicity, the following technical problems need to be solved: (1) estimating background seismicity rate, (2) estimating the model parameters (A, α, c, p, D, q, γ), and (3) forecasting by using the fitted model. The solutions to (1), (2) and (3) are addressed in Subsections 3.1 to 3.3, respectively.
3.1 Estimating time-independent total seismicity and background seismicity
Given a dataset of earthquake occurrence times, locations, and magnitudes, the time-independent total seismicity is usually estimated by some nonparametric method, such as splines (Ogata, 1998), kernel functions (Zhuang et al, 2002; Helmstetter et al., 2007), grid averaging (Tsukakoshi and Shimazaki, 2006), and Tessellation (Ogata, 2004b). In this paper, we consider using the variable kernel estimate (Zhuang et al., 2002). This approach is simple and tackles a serious disadvantage of the simple kernel estimate with a fixed bandwidth: for a spatially clustered point dataset, a small bandwidth gives a noisy or variable estimate for the sparsely populated area, while a large bandwidth mixes up the boundaries between the densely populated areas and the sparsely populated areas. Therefore, given observations in the time interval [0, T], instead of the kernel estimate

where Z d (x, y) denotes the Gaussian kernel function

with a fixed bandwidth d, we adopt

where d j represents the varying bandwidth calculated for each event j in the following way. Given a suitable integer n p , d j takes the value of the distance between Event j and its n p th nearest neighbor. Because d j may be zero when several events overlap at the same location, we also set d j a threshold value ε (e.g., a distance about 0.02°, which is of the order of the location error) if this distance is less than ε.
Similar to estimating total seismicity, many approaches have also been developed for assessing background seismicity rate: (1) proportional to total seismicity rate of all events or only of the big events in the catalog (Musmeci and Vere-Jones, 1986; Console et al., 2003); (2) using a declustering method to decluster the catalog and use the total rate in the declustered catalog as background rate (Ogata, 1998; Helmstetter et al., 2006; Werner et al., 2011); (3) weighting each event by background probability that it is a background event (Zhuang et al., 2002, 2004); and (4) the method introduced by Ogata (2004b), which is a Bayesian smoothness prior on a tessellation grids to estimate the spatial variation of the background and the model parameter at the same time. In this study, the third method is used because it is relatively simple and gives an unbiased estimate of the intensity function.
Using the method described in the last paragraph of Section 2, once a background process is obtained, we can estimate the background intensity by applying some smoothing techniques to the background catalog. Rather than repeat the thinning procedure and the kernel estimation procedure many times to obtain an average estimate of the background intensity, the average can be estimated directly by weighting all the events with their corresponding background probabilities, i.e.,
where i runs over all of the events in the whole process, and Z d is the Gaussian kernel function with a bandwidth d. The variable bandwidth d j is defined in the same way as in Eq. (10).
To find optimal values of n p and ε in Eq. (10) and Eq. (11), I apply the above variable kernel functions to estimate the rates of simulated inhomogeneous Poisson point processes. Cross-validation (see, e.g., Picard and Cook, 1984) reveals that the optimal n p is in the range 3~6, but not in the range 20~100 as declared in Zhuang et al. (2002). The parameter ε does not influence the prediction too much—if the locations of points are not rounded at a certain precision. This parameter only becomes important when some points happen to overlap at one location caused by rounding the numbers. Also, smaller n p and ε make Algorithm A easier to converge.
3.2 Iterative algorithm
As pointed out in Section 2, when the background rate is known, the maximum likelihood method can be used to estimate model parameters. However, in most cases, the background rate is unknown. To estimate the model parameters and the background seismicity rate simultaneously, Zhuang et al. (2002) introduced the following iterative algorithm.
Algorithm A: Simultaneous estimation of the model parameters and the background intensity
-
A1.
Given a fixed n p and ε, say 5 and 0.05° (equivalent to 5.56 km on the earth surface, which is close to the location error of earthquakes), calculate the bandwidth h j for each event (t j , x j , m j ), j = 1, 2, · · ·, N.
-
A2.
Set l ← 0, and u(0)(x, y) ← 1.
-
A3.
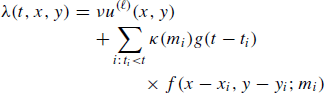
Using the maximum likelihood procedure (see, e.g., Ogata, 1998), fit the model with conditional intensity function
 (12)
(12)to the earthquake data, where κ, g, and f are defined in Eq. (4) to Eq. (6), and ν is the relaxing coefficient, which is introduced in order to fasten the convergency speed of this algorithm. The model parameters are (ν, A, α, c, p, D, q, γ).
-
A4.
Calculate f i for j = 1, 2, · · ·, N by using Eq. (8).
-
A5.
Calculate µ(x, y) by using Eq. (11) and record it as u(l+1)(x, y).
-
A6.
A6. If max |u(l+1)(x, y) — u(l)(x, y)| > e, where e is a given small positive number, then set l ← l + 1 and go to step A3; otherwise, take νu(l+1)(x, y) as the background rate and also output ρ ij , ρ i and φ i .
3.3 Simulation method and forecasting procedure
Given the observation up to time t, to forecast whether there is one earthquake or more in the next time interval [t, t + Δt] in a region S, Helmstetter et al. (2006) and Werner et al. (2011) used a direct and quick approach to compute the expectation of the number of events occurring in [t, t + Δt] × S by

and the probability that at least one event occur by

where λ(t, x, y) in [t, t + Δt] × S is calculated by assuming no event occurring from t. There is no problem with Eq. (14). However, Eq. (13) underestimates because, earthquakes occurring [t, t + Δt], inside or outside S, increase λ(t, x, y). This underestimation becomes worse during the periods of active triggering. In this study, we estimate the expectations and probabilities associated with future earthquakes by simulation in order to avoid such a bias. Comparing using Eq. (13), simulation gives a better estimation of the future seismicity, but at a more expensive computation cost.
Suppose that observation data are available up to time t, but not including t. The following algorithm (modified from Zhuang et al., 2004) can then be used to simulate the seismicity in the interval [t, t + Δt].
Algorithm B: Simulation of the space-time ETAS model
-
B1.
Generate the background catalog with the estimated background intensity
 in Eq. (11). For each event in the background catalog, generate a random variable U
i
uniformly distributed in [0, 1], accept it if U
i
< νφ
i
Δt /(t - t0), where ν is as defined in (12), t0 is the starting time of the catalog and thus t - t0 is the length of period of data fitted to the model. Randomly assign each selected event a new time uniformly distributed in [t, t + Δt], and relocate each selected event by adding a 2D Gaussian random variable with a density
in Eq. (11). For each event in the background catalog, generate a random variable U
i
uniformly distributed in [0, 1], accept it if U
i
< νφ
i
Δt /(t - t0), where ν is as defined in (12), t0 is the starting time of the catalog and thus t - t0 is the length of period of data fitted to the model. Randomly assign each selected event a new time uniformly distributed in [t, t + Δt], and relocate each selected event by adding a 2D Gaussian random variable with a density  , where Z is the kernel function used in estimating the background seismicity and d
i
is the bandwidth corresponding to the selected event. Recorded these new events as Generation 0, namely G'(0).
, where Z is the kernel function used in estimating the background seismicity and d
i
is the bandwidth corresponding to the selected event. Recorded these new events as Generation 0, namely G'(0). -
B2.
Let the initial catalog G(0) be the collection of all the events in G'(0) and all the observed events before t.
-
B3.
Set 2113 ← 0.
-
B4.
For each event i, namely (t i , x i , y i , m i ), in the catalog G(l), simulate its N(i) offspring, namely,
 , where N(i) is a Poisson random variable with a mean of κ(m
i
), and
, where N(i) is a Poisson random variable with a mean of κ(m
i
), and  and
and  are generated from the probability densities g(· - t
i
), f(· - x
i
, · - y
i
, m
i
) and s(·) respectively. Let
are generated from the probability densities g(· - t
i
), f(· - x
i
, · - y
i
, m
i
) and s(·) respectively. Let  :
: -
B5.
Set
 .
. -
B6.
If G(l) is not empty, let l ← l + 1 and go to Step B4; else return
 .
.
 in
in  , where Z is the kernel function used in estimating the background seismicity and d
i
is the bandwidth corresponding to the selected event. Recorded these new events as Generation 0, namely G'(0).
, where Z is the kernel function used in estimating the background seismicity and d
i
is the bandwidth corresponding to the selected event. Recorded these new events as Generation 0, namely G'(0). , where N(i) is a Poisson random variable with a mean of κ(m
i
), and
, where N(i) is a Poisson random variable with a mean of κ(m
i
), and  and
and  are generated from the probability densities g(· - t
i
), f(· - x
i
, · - y
i
, m
i
) and s(·) respectively. Let
are generated from the probability densities g(· - t
i
), f(· - x
i
, · - y
i
, m
i
) and s(·) respectively. Let  :
: .
. .
.To forecast seismicity in [t, t + Δt], we first do many simulations using Algorithm B, say, the number of simulations, K = 10,000. The expected number of events in a cell [t, t + Δt] × S can be estimated through

and

In order to obtain stable and smoothed forecasts, instead of the above two equations, the events are smoothed in all the simulations by using

and

where  is the location of the i th event in the jth simulation, n
j
is the number of events in the jth simulation, K is the total number of simulations, and h is the normal kernel function, with a bandwidth of 0.3° in this study.
is the location of the i th event in the jth simulation, n
j
is the number of events in the jth simulation, K is the total number of simulations, and h is the normal kernel function, with a bandwidth of 0.3° in this study.  is used instead of E here because these expectations are not obtained from the unknown “true” distribution, but from the estimated model.
3.4 Off-line optimization and online forecasting
A drawback in the above algorithm is that the iterative algorithm for simultaneously estimating the background and model parameter takes quite a long time to compute. For example, it takes usually about 5 h to fit a catalog of 20,000 events on a 48-core linux cluster with Intel CPU X5460@3.2GHz. For this reason, we can use an offline optimization and online forecasting scheme to tackle this problem, as illustrated in Fig. 1. In the off-line side, Algorithm A is used to estimate the model parameters and the background rate by fitting the model to the available records of seismicity at the time when the optimization is started. Once the parameters are estimated, the new parameters are sent to the online forecasting computer. In the online forecasting procedure, a simplified version of Algorithm A, say A', is run with the newest parameters to find the background rate and to calculate background probabilities. A' is the same as Algorithm A except that Step A3 is skipped. After Algorithm B is used many times to simulate the seismicity in the forecast space-time-magnitude range, Eq. (17) and Eq. (18) are applied to all simulations to obtain smoothed forecasts.

Illustration of the “off-line optimization and online forecasting” scheme for the implementation of the ETAS model in CSEP.
4. A Retrospective Forecasting Experiment on the Seismicity before and after the 2003 Tokachi-Oki Earthquake
4.1 Data
A retrospective forecasting experiment is performed in this section to illustrate the above methodologies. We select data from the JMA catalog in the ranges of longitude 121~155°E, latitude 21~48°N, depth 0~100 km, time 1 January 1965 to 23 September 2003, and magnitude MJ = 4.0 (Fig. 2). There are 19,019 events in this dataset. The Tokachi-Oki earthquake (MJ8.0) occurred on 26 September 2003, 3 days after the end of this period. The seismicity before and after this earthquake has been well studied. For example, Ogata (2004a) found synchronous seismicity changes in and around its epicenter, which can be explained as the changes in the Coulomb failure stress caused by an aseismic slip, Murase (2004) found the fractal dimension change before its occurrence, and, the seismicity has been shown to be quiescent at the depth of about 100 km and be activated at the depth of about 250 km near the focal region from 1998 onwards (Institute of Seismology and Volcanology, Hokkaido University, 2004).

(a) Epicenter map of the shallow earthquakes (MJ = 4.0 and depth = 100, 1 January 1926 to 22 September 2003) from the JMA catalog; (b) a space-time plot of latitudes against occurrence times, and (c) a space-time plot of occurrence times against longitudes. The polygon in (a) represents the target region used in the likelihood computation, and the dark dots and gray dots represent the target events and complementary events, respectively.
Fitting space-time ETAS to the catalog is not an easy task. For an earthquake catalog covering records of a time period of 38 years, completeness and homogeneity, or the lack thereof, are always problems in a statistical analysis. For example, when seismicity in some regions or the whole region has an increasing trend, the fitting results do not converge or they converge to some unreasonable values. In this study, a target space-time range was chosen in which the seismicity seems to be relatively and visually complete and homogeneous above 4.0 (see Table 1). Figure 2(a) shows the target region with the same depth and magnitude ranges to fit the model. The events outside of this study space-time range are used as complementary events for calculating the conditional occurrence rate λ in order to illuminate the boundary effect. See Figs. 2(b) and 2(c) for assessment of such a choice.
The final estimates of the parameters are  (events/day),
  (events),
  day,
day,  and
and  , which is similar to the results of Zhuang et al. (2004, 2008). We regard these parameters as obtained from the off-line optimization and use them to forecast seismicity during the period 23 September to 22 October 2003. The total seismicity estimated using Eq. (10) and the background seismicity rate estimated using Eq. (11) are shown in Figs. 3(a) and 3(b), respectively.

Total seismicity occurrence rate (a) and background seismicity rate estimated by using the data before the Tokachi-Oki earthquake (unit: events/day/deg2).
4.2 Comparison between observations and forecasts
We assume that each forecast is for seismicity starting at 0:00 and ending at 24:00 (UTC) on each day. Figure 4 gives the forecasting map of expected intensity of events in the unit of events/day/deg2. Prior to the Tokachi-Oki earthquake, the density map is similar to the background Poisson model (Fig. 3(b)). After the occurrence of the mainshock, seismicity in the Hokkaido region is dominated by aftershocks. If the forecast is carried out shortly after the mainshock, it is possible that the forecast can be improved. In Fig. 4(b), this feature has been well captured by the ETAS model. Ten days after the mainshock has occurred, the rate of aftershocks decays to a low level, but is still much higher than the average level, as shown in Fig. 3(a).

Examples of forecasted images of expected numbers of earthquakes on (a) 24 September 2003, (b) 25 September 2003, (c) 26 September 2003 and (d) 13 October 2003. (unit: events/day/deg2). The green circles mark the locations of earthquakes (MJ = 4.0) occurring in forecasting time period.
Figure 5 plots the expected forecasted numbers of earthquakes in the target polygon (shown in Fig. 2) and their 5% and 95% quantiles and the corresponding observations on each day before and after the occurrence of the mainshock. This plot shows that the forecast also captures the temporal evolution feature of the triggered seismicity, such as decaying in time and multistage triggering.

Temporal variation of forecasted daily numbers of earthquakes (sun crosses) in the region (N126°~148°, E28°~45°) during 24 September 2003 to 22 October 2003. The hexagrams mark observed daily numbers of earthquakes.
4.3 Evaluation of forecasting performance
There are several ways to evaluate the forecast performances. (1) the R-score or Hanssen-Kuiper skill score (see, e.g., Shi et al., 2001; Harte and Vere-Jones, 2005; Console et al., 2010); (2) Molchan’s error diagram (see, e.g., Molchan, 1990); (3) the entropy or information score (see, e.g., Vere-Jones, 1998); (4) the gambling score (Zhuang, 2010). In this study, we use the entropy score to evaluate the performance of the forecast.
Firstly, we divide the whole region of the polygon given in Fig. 2(a) into 1° × 1° cells. For each cell D k , we estimate the probability that at least one event will occur the next day as

where  represents the location of the ith event in the jth simulation, and h is the normal kernel function, with a bandwidth of 0.3° in this study. The corresponding probability estimated by the Poisson model is

where  is estimated according to Eq. (10) and given in Fig. 3(a). The information gain for cell D
k
is
is estimated according to Eq. (10) and given in Fig. 3(a). The information gain for cell D
k
is

where X k = 1 if one or more events occur in D k , and X k = 0 otherwise. The total information gain is

with k runs over all the space-time cells.
The results are shown in Fig. 6. We also learn that the information gain (natural logarithm of probability gain) per day is 6.88 and per event is 0.974. It is not surprising that the ETAS model shows better performance in forecasting earthquakes than the Poisson model, as shown by Helmstetter et al. (2006), Console et al. (2007, 2010), Murru et al. (2009), and Marzocchi and Lombardi (2009).

Daily information gains against the Poisson model.
It can be seen from Figs. 4(b) and 6 that, on the occurrence day of the mainshock, the ETAS model has a lower score than the Poisson model. This can be explained by the fact that the ETAS model basically forecasts with its background rate, which is of course lower than the average rate of the fitted Poisson model, for the day of the mainshock together with a burst of many aftershocks and gives lower probabilities of earthquake occurrences if there is no fore-shock has occurred nearby in the recent past. In the cases of the Landers earthquake in California and the L’aquila earthquake in Central Italy, some foreshocks occurred before the mainshocks, and quite high probabilities of earthquakes were forecasted by the ETAS model (Helmstetter et al., 2006; Marzocchi and Lombardi, 2009; Werner et al., 2011).
5. Discussion
5.1 Evolution of model parameters
It is instructive to study the evolution of the parameters over time and with new data. In this article the parameters are estimated just once, and it is therefore questionable how strongly they vary over the forecasting period. Firstly, these parameters do not change very much. To see how the model parameters evolve over time and with new data, I fit the model to the observation data each time before a forecast is made, during the forecast period from 23 September to 22 October 2003. The ranges of the estimates are µ ∈ [0.2691, 0.2743] (events/day/deg2), A ∈ [0.4112,0.4280] (events), c ∈ [0.00723,0.00761] (day), α ∈ [1.2349, 1.2665], p ∈ [1.0684, 1.0710], D ∈ [0.000131,0.000136] (deg2), q ∈ [1.5875,1.5976], and γ ∈ [1.3076, 1.3656], showing that the variations are quite small. Secondly, in my opinion, the ETAS model is quite a stable model. That is to say, given the observation history, quite reasonable results can be obtained for short-term forecasts by using the ETAS model with some typical parameters, without fitting the model to the past seismicity. The differences between forecasts made using typical parameters and those made using the maximum likelihood estimates can be only distinguished through strict statistical tests, but not visually.
5.2 Stability of simulations
Another question is whether the simulations are sufficient to sample the possibilities. Simulations are definitely required to obtain forecasts with sufficient precision. In this study, we simulate K = 10,000 times for each forecast. Suppose that the probability that there are exactly k events in a given space-time-magnitude range is p k . The estimate of p k is

By the central limit theorem,  is approximately normally distributed with a mean of p
k
and a standard deviation of
is approximately normally distributed with a mean of p
k
and a standard deviation of  . When p
k
is not so small, for example, larger than 0.01, the estimated error is less than 10%. Only when p
k
is small does the relative deviation
. When p
k
is not so small, for example, larger than 0.01, the estimated error is less than 10%. Only when p
k
is small does the relative deviation  become large. In our analysis, K =10,000 indicates that s/p
k
is up to 100% when p
k
is less than 10-5. This should not cause a problem for our forecasts. Once we get a small probability in practice, its estimated value, for example, 10-5 or 1010-6, does not make a big difference in terms of decision making, both of them being regarded as negligible. One may argue that, in the case of many space-time-magnitude grids, each with such low occurrence probabilities, the estimate of the overall probability that there are some events occurring in any of these grids will be wrongly estimated. However, in this case, the overall occurrence probability would not be obtained by mathematical operations on these small probabilities; rather, it would be estimated directly through the number of simulations that there are some events occurring in any of the grids. Moreover, another technique adopted in our procedures to make the results stable is that the simulations are smoothed by using kernel functions. Based on the above, stability should not be a problem with the forecasting procedures provided in this study.
become large. In our analysis, K =10,000 indicates that s/p
k
is up to 100% when p
k
is less than 10-5. This should not cause a problem for our forecasts. Once we get a small probability in practice, its estimated value, for example, 10-5 or 1010-6, does not make a big difference in terms of decision making, both of them being regarded as negligible. One may argue that, in the case of many space-time-magnitude grids, each with such low occurrence probabilities, the estimate of the overall probability that there are some events occurring in any of these grids will be wrongly estimated. However, in this case, the overall occurrence probability would not be obtained by mathematical operations on these small probabilities; rather, it would be estimated directly through the number of simulations that there are some events occurring in any of the grids. Moreover, another technique adopted in our procedures to make the results stable is that the simulations are smoothed by using kernel functions. Based on the above, stability should not be a problem with the forecasting procedures provided in this study.
5.3 Other information-based scoring methods
In the evaluation of the forecasting performance, the probabilities that one or more events occur in each forecasting space-time-magnitude window are used as forecasting results. In fact, through simulation, it is not difficult to forecast the full distribution of the numbers of events and use the Poisson information score to evaluate the forecast performance (see, e.g., Vere-Jones, 1998; Werner et al., 2011). In this study, I do not consider this format of forecasts and the Poisson information score because, as shown by Vere-Jones (1998), the binary score is equivalent to the Poisson score asymptotically. The significant superiority of the ETAS model in forecasting seismcity to the Poisson model in binomial information score implies that the ETAS model also performs better than the Poisson model in the Poisson information score.
5.4 Influence of small events
This study does not consider the triggering effect from smaller events that are below the magnitude threshold, 4.0. The reason for this is that there are already have more than 19,000 events of MJ = 4.0 in the catalog, and if the magnitude threshold is lowered, the number of selected events increases vastly and it takes much more computation time to fit the model to the data, since the computation time is approximately proportional to the square of the number of events. However, as shown by several researchers (see, Helmstetter and Sornette, 2003; Helmstetter et al., 2003; Werner, 2007; Zhuang et al., 2008), small events are important in triggering large earthquakes. Also, cutting-off the triggering effect from the events lower than magnitude threshold is one of the biggest sources of the estimating errors (Wang et al., 2010), while including the smaller events in the observation history improves the forecasts (Werner et al., 2011).
6. Concluding Remarks
The space-time ETAS model has been implemented as an “off-line optimization and online forecasting” scheme in the Japan and SCEC CSEP projects. It consists of four components: (1) off-line optimization, which computes optimal model parameters for future uses in forecasting; (2) a simulation procedure, which simulates many copies of possibilities of earthquake occurrence in a future time interval, based on the last updated parameters and most recent records of seismicity; (3) a smoothing procedure, which smoothes the events generated in the simulation step to obtain stable and smoothed spatiotemporal occurrence rate; (4) a forecast performance evaluation procedure, which uses the CSEP common evaluation framework.
Using the ETAS model, I have made retrospective experiments on 1-day forecasts of earthquake probabilities in the Japan region before and after the Tokachi-Oki earthquake in September 2003, in the format of contour images. The optimal parameters for the forecasts were obtained by fitting the ETAS model to the previous observations. Once the parameters are obtained, the seismicity for the next forecast interval was simulated many times based on the ETAS model. The probabilities of earthquake occurrences were estimated as the ratio of the number of simulations that one or more earthquakes occur to the total number of simulations. These forecasts were test against the reference model, the Poisson process which is stationary in time but spatially inhomo-geneous. As expected, the forecasts based on the ETAS model catch the temporal and spatial features of the aftershock sequence, and the ETAS model performs better than the Poisson model.
References
Console, R., M. Murru, and A. M. Lombardi, Refining earthquake clustering models, J. Geophys. Res., 108(B10), 2468, 2003.
Console, R., M. Murru, F. Catalli, and G. Falcone, Real time forecasts through an earthquake clustering model constrained by the rate-and-state constitutive law: comparison with a purely stochastic ETAS model, Seismol. Res. Lett., 78(1), 49–56, 2007.
Console, R., M. Murru, and G. Falcone, Probability gains of an epidemic-type aftershock sequence model in retrospective forecasting of m = 5 earthquake in Italy, J. Seismol., 14(1), 9–26, 2010.
Daley, D. D. and D. Vere-Jones, An Introduction to Theory of Point Processes—Volume 1: Elementrary Theory and Methods (2nd Edition), Springer, New York, NY, 2003.
Fletcher, R. and M. J. D. Powell, A rapidly convergent descent method for minimization, Comput. J., 6(2), 163–168, 1963.
Hainzl, S. and Y. Ogata, Detecting fluid signals in seismicity data through statistical earthquake modeling, J. Geophys. Res., 110, B05S07, 2005.
Harte, D. and D. Vere-Jones, The entropy score and its uses in earthquake forecasting, Pure Appl. Geophys., 162(6), 1229–1253, 2005.
Hawkes, A., Spectra of some self-exciting and mutually exciting point processes, Biometrika, 58, 83–90, 1971a.
Hawkes, A., Point spectra of some mutually exciting point processes, J. R. Statist. Soc.: Ser. B (Statistical Methodology), 33, 438–443, 1971b.
Helmstetter, A. and D. Sornette, Foreshocks explained by cascades of triggered seismicity, J. Geophys. Res., 108(B10), 2457, 2003.
Helmstetter, A., G. Ouillon, and D. Sornette, Are aftershocks of large Californian earthquakes diffusing?, J. Geophys. Res., 108(B10), 2483, 2003.
Helmstetter, A., Y. Y. Kagan, and D. D. Jackson, Comparison of short-term and time-independent earthquake forecast models for southern California, Bull. Seismol. Soc. Am., 96(1), 90–106, 2006.
Helmstetter, A., Y. Y. Kagan, and D. D. Jackson, High-resolution time-independent forecast for m = 5 earthquakes in California, Seismol. Res. Lett., 78, 59–67, 2007.
Institute of Seismology and Volcanology, Graduate School of Science, Hokkaido University, Seismic quiescence and activation prior to the 2003 Tokaichi-Oki earthquake, in Report of the Coordinating Committee for Earthquake prediction, edited by Geographical Survey Institute, 72, 118–119, 2004.
Kagan, Y. and L. Knopoff, Statistical search for non-random features of the seismicity of strong earthquakes, Phys. Earth Planet. Inter., 12, 291–318, 1976.
Lombardi, A. M., M. Cocco, and W. Marzocchi, On the increase of background seismicity rate during the 1997–1998 Umbria–Marche (central Italy) sequence: Apparent variation or fluid-driven triggering?, Bull. Seismol. Soc. Am., 100(3), 1138, 2010.
Marzocchi, W. and A. M. Lombardi, Real-time forecasting following a damaging earthquake, Geophys. Res. Lett., 36, L21302, 2009.
Molchan, G. M., Strategies in strong earthquake prediction, Phys. Earth Planet. Inter., 61(1–2), 84–98, 1990.
Murase, K., A characteristic in fractal dimension prior to the 2003 Tokachi-Oki earthquake (m j = 8.0), Hokkaido, northern Japan, Earth Planets Space, 56, 401, 2004.
Murru, M., R. Console, and G. Falcone, Real time earthquake forecasting in italy, 470, 214–223, 2009.
Musmeci, F. and D. Vere-Jones, A variable-grid algorithm for smoothing clustered data, Biometrics, 42, 483–494, 1986.
Nanjo, K. Z., H. Tsuruoka, N. Hirata, and T. H. Jordan, Overview of the first earthquake forecast testing experiment in Japan, Earth Planets Space, 63, this issue, 159–169, doi:10.5047/eps.2010.10.003, 2011.
Ogata, Y., On lewis’ simulation method for point processes, IEEE Trans. Information Theory, IT-27(1), 23–31, 1981.
Ogata, Y., Space-time point-process models for earthquake occurrences, Ann. Inst. Statist. Math., 50, 379–402, 1998.
Ogata, Y., Seismicity quiescence and activation in western Japan associated with the 1944 and 1946 great earthquakes near the nankai trough, J. Geophys. Res., 109(B4), B04305, 2004a.
Ogata, Y., Space-time model for regional seismicity and detection of crustal stress changes, J. Geophys. Res., 109(B3), B03308, 2004b.
Ogata, Y. and J. Zhuang, Space–time ETAS models and an improved extension, Tectonophysics, 413(1–2), 13–23, 2006.
Picard, R. and D. Cook, Cross-validation of regression models, J. Am. Statist. Assoc., 79, 575, 1984.
Shi, Y., J. Liu, and G. Zhang, An evaluation of Chinese earthqauike prediction, 1990–1998, J. Appl. Prob., 38A, 222–231, 2001.
Tsukakoshi, Y. and K. Shimazaki, Temporal behavior of the background seismicity rate in central Japan, 1998 to mid-2003, Tectonophysics, 417, 155–168, 2006.
Vere-Jones, D., Stochastic models for earthquake occurrence, J. R. Statist. Soc.: Ser. B (Statistical Methodology), 32(1), 1–62, 1970.
Vere-Jones, D., Probability and information gain for earthquake forecasting, Comput. Seismol., 30, 248–263, 1998.
Wang, Q., D. D. Jackson, and J. Zhuang, Missing links in earthquake clustering models, Geophys. Res. Lett., 37, L21307, 2010.
Werner, M. J., On the fluctuations of seismicity and uncertainties in earthquake catalogs: Implications and methods for hypothesis testing, Ph.D. thesis, Univ. of Calif., Los Angeles, 2007.
Werner, M. J., A. Helmstetter, D. D. Jackson, and Y. Y. Kagan, High-resolution Time-independent Grid-based Forecast for M >= 5 Earthquakes in California, Bull. Seismol. Soc. Am., 2011 (revising).
Zhuang, J., Second-order residual analysis of spatiotemporal point processes and applications in model evaluation, J. R. Statist. Soc.: Ser. B (Statistical Methodology), 68(4), 635–653, 2006.
Zhuang, J., Gambling scores for earthquake predictions and forecasts, Geophys. J. Int., 181, 382–390, 2010.
Zhuang, J., Y. Ogata, and D. Vere-Jones, Stochastic declustering of space-time earthquake occurrences, J. Am. Statist. Assoc., 97(3), 369–380, 2002.
Zhuang, J., Y. Ogata, and D. Vere-Jones, Analyzing earthquake clustering features by using stochastic reconstruction, J. Geophys. Res., B5(3), B05301, 2004.
Zhuang, J., C.-P. Chang, Y. Ogata, and Y.-I. Chen, A study on the background and clustering seismicity in the Taiwan region by using a point process model, J. Geophys. Res., 110, B05S13, 2005.
Zhuang, J., A. Christophosen, M. K. Savage, D. Vere-Jones, Y. Ogata, and D. D. Jackson, Differences between spontaneous and triggered earthquakes: their influences on foreshock probabilities, J. Geophys. Res., 113, B11302, 2008.
Acknowledgments
This research is supported by Grant-in-Aid Nos 20240027 for Scientific Research (A), and 20840043 for Young Scientists (Startup), both from Ministry of Education, Science, Sports and Culture, Japan. The author thanks Denjel Schrommer and Maria Liuks, for their assistance in implementing the above procedure to SCEC CSEP project, and Kazuyoshi Nanjo and Hiroshi Tsuruoka, for implementing it in Japan CSEP. Support from Prof. David Jackson from UCLA and Prof. Yosihiko Ogata from ISM is also gratefully acknowledged. The author also thanks Dr. Takashi Iidaka, Dr. Kazuyoshi Nanjo, Dr. Max Werner and Dr. Rodolfo Console for their helpful comments and suggestions.
Author information
Authors and Affiliations
Corresponding author
Rights and permissions
Open Access This article is licensed under a Creative Commons Attribution 4.0 International License, which permits use, sharing, adaptation, distribution and reproduction in any medium or format, as long as you give appropriate credit to the original author(s) and the source, provide a link to the Creative Commons licence, and indicate if changes were made.
The images or other third party material in this article are included in the article’s Creative Commons licence, unless indicated otherwise in a credit line to the material. If material is not included in the article’s Creative Commons licence and your intended use is not permitted by statutory regulation or exceeds the permitted use, you will need to obtain permission directly from the copyright holder.
To view a copy of this licence, visit https://creativecommons.org/licenses/by/4.0/.
About this article
Cite this article
Zhuang, J. Next-day earthquake forecasts for the Japan region generated by the ETAS model. Earth Planet Sp 63, 207–216 (2011). https://doi.org/10.5047/eps.2010.12.010
Received:
Revised:
Accepted:
Published:
Issue Date:
DOI: https://doi.org/10.5047/eps.2010.12.010