- Full paper
- Open access
- Published:
Simple kinetic model for replacement reactions involving solid solutions: the significant role of geofluids
Earth, Planets and Space volume 72, Article number: 8 (2020)
Abstract
We develop a kinetic model that illustrates the relative role of intergranular diffusion and surface reactions in overall metamorphic net-transfer reactions involving solid solutions. The behavior and state of the system were observed to depend on the non-dimensional parameter(s), defined herein by \(\gamma \equiv (k \cdot L \cdot K^{n-1}) /D^{\mathrm{eff}}\), where k denotes the dissolution rate constant of the mineral, L denotes the distance between the two minerals participating in the reaction, K denotes the coefficient of the equilibrium abundance ratio of the precipitated component in the intergranular fluid to those in the mineral, n denotes the order of the dissolution reaction, and \(D^{\mathrm{eff}}\) denotes the effective diffusion coefficient of the precipitated component in the intergranular fluid. When \(\gamma\) is small, the system becomes homogeneous, which is controlled by the surface reaction. In contrast, a large \(\gamma\) implies a heterogeneous system controlled by both surface reaction and diffusion. Geofluid is among the most important influencers of kinetic regimes and reaction textures in metamorphic and metasomatic rocks because the intergranular fluid distribution considerably affects the intergranular diffusivity (\(D^{\mathrm{eff}}\)). Our conceptual model can potentially reveal the nature of the reaction kinetics and the fluid–rock interactions and capture the complex behaviors of natural systems in future extensions.

Introduction
Understanding the kinetics and mechanisms of mineral reactions in rocks is important for extracting information about fluid–rock interactions and various related geodynamic processes (e.g., Lasaga 1998). Metamorphic rocks exhibit compositional heterogeneity caused by an extensive variety of reaction textures, which might directly result from various types of reaction kinetics and mechanisms in natural systems (e.g., Thompson and Rubie 1985; Carlson 2002; Vernon 2004). Although they are the consequences of numerous complicated and overlapped individual micro-scale processes, simple models are essential for understanding the overall behavior of the system, such as the equilibrium state and the rate-determining process, as well as their governing parameters.
Previous researchers have proposed simple conceptual models that consider the mechanisms and kinetics of the reactions between two minerals separated by an intergranular fluid (Dohmen and Chakraborty 2003; Lasaga 1986). Lasaga’s pioneering model analyzes the single-component solid–fluid equilibria, where the effect of solid solution is not considered (Lasaga 1986). The two extreme kinetic regimes (the surface-reaction-controlled regime and the mass-transport-controlled regime) can be switched using a non-dimensional governing parameter describing the relative importance ratio of the surface reaction to diffusion. This model has been extended to the exchange reactions of elements or isotopes containing solid solutions (Dohmen and Chakraborty 2003). The various rate-controlling processes and system behaviors were then predicted by a reaction mechanism map based on this updated model. Dohmen and Chakraborty (2003) demonstrated that most of the natural minerals are solid solutions governed by more complicated reaction kinetics than simple diffusion or interface control.
The present study focuses on net-transfer reactions involving addition and/or loss of phases involving solid solutions. Net-transfer reactions are the main processes of metamorphic and metasomatic reactions and are essential for investigating the fluid–rock interactions because they alter the constituent minerals and considerably affect the properties of both rocks and fluids.
Metamorphic rocks often contain pseudomorphs and pseudomorph-like structures, providing direct evidence of replacement-type net-transfer reactions (e.g., Vernon 2004). In some cases, the newly precipitated minerals are homogeneously distributed through the system (Kuwatani and Toriumi 2017; Okamoto and Toriumi 2005). The mineral assemblages, mineral compositions, and local bulk compositions are then very similar even when they replace different host minerals. In contrast, newly precipitated minerals can depend on the host minerals: the mineral assemblages, mineral compositions, and local bulk composition. The newly precipitated minerals then differ in different types of original host minerals. For example, the amphiboles in hydrated granulite have pargasite and magnesio–hornblende compositions on garnet and clinopyroxene host minerals, respectively (Centrella et al. 2015). Amphiboles with pargasite and magnesio–hornblende compositions on garnet and omphacite, respectively, have also been reported in hydrated eclogite (Kuwatani and Toriumi 2008; Yang 2004; Yang et al. 2004). Understanding the mechanism controlling such contrasting reaction textures and extracting as much information about the system as possible from the compositions of precipitated minerals is vital (e.g., Lanari and Engi 2017).
This study proposes a new kinetic model that captures the relative role of diffusion and surface reactions in metamorphic net-transfer reactions involving solid solutions. The model is based on some previous studies (Dohmen and Chakraborty 2003; Lasaga 1986). Using the proposed idealized model, one can investigate the net-transfer reactions involving dissolution and precipitation, namely the replacement reactions of solid solutions, in a binary solution system. Our intention is not to mimic the complex minerals in natural systems, but to model the zeroth-order physical and chemical behavior leading to reaction textures and the compositional heterogeneity of rocks.
We first explain the model setting and its mathematical formulations. A list of symbols and their units is given in Table 1. Further, we analytically solve the governing equations that provide the governing parameters controlling the mechanism and behavior of the system. Using these parameters, we map the reaction mechanisms and explain the reaction behavior on each region of the map based on its characteristic kinetic regime. Finally, we discuss the implications of our results to understand the geofluid behaviors and provide suggestions for future studies.
Overall description of the model system
Figure 1 illustrates the situation present in the model, where minerals A and B at a distance L are connected through a conduit of intergranular fluid. Minerals A and B are assumed to be pure or end-member minerals, containing only the \(\alpha\) and \(\beta\) components, respectively. The whole system, including these minerals and the intergranular fluid, is considered to exist under the non-equilibrium condition, driving the overall reaction. Further, a replacement reaction occurs on each side, which includes the dissolution of the unstable mineral, A or B, and the simultaneous precipitation of a new, different mineral having a composition that is in equilibrium with that of the adjacent fluid. The newly precipitated minerals are assumed to be in the same solid-solution phase \(\mathrm {A}_{X_{\alpha }} \mathrm {B}_{X_{\beta }}\) but with different compositions.

Schematic of our model system. Two unstable minerals, A and B, are located on opposite sides and interact through a fluid conduit of length L. A replacement reaction occurs at each mineral surface. Minerals A and B react with rates \(R_{\mathrm{A}}\) and \(R_{{\mathrm{B}}}\) respectively, and the chemical formulas of their precipitates are expressed as \(\mathrm {A}_{X_{\alpha }^{{\mathrm{A}}}} \mathrm {B}_{1-X_{\alpha }^{{\mathrm{A}}}}\), and \(\mathrm {A}_{X_{\alpha }^{\mathrm{B}}} \mathrm {B}_{1-X_{\alpha }^{{\mathrm{B}}}}\), respectively. Note that the precipitating solid-solution mineral \(\mathrm {A}_{X_{\alpha }} \mathrm {B}_{1-X_{\alpha }}\) is a different mineral from the dissolving minerals, A and B. The concentration profiles of species \(\alpha\) and \(\beta\) in the fluid channel are also shown. The linear concentration gradients of \(C_{\alpha }\) and \(C_{\beta }\) are obtained under an assumed steady-state condition. The concentrations of \(\alpha\) and \(\beta\) are completely coupled, indicating a single-component system (see text). Notably, the newly precipitated minerals are assumed to exist only at one side of the respective dissolved minerals and not to fill the fluid conduit
The element or component required for the formation of new minerals is transported by intergranular diffusion. The \(\alpha\) and \(\beta\) species are transferred from A to B and from B to A, respectively. As discussed below, the physical properties related to \(\alpha\) and \(\beta\), such as the diffusion coefficients and the coefficients of the equilibrium abundance ratios, are assumed identical to simplify the model. In this situation, the behaviors of \(\alpha\) and \(\beta\) are completely coupled, and the modeling can be described in terms of the \(\alpha\) component alone. Furthermore, the proposed model predicts the precipitated mineral compositions \(\mathrm {A}_{X_{\alpha }} \mathrm {B}_{1-X_{\alpha }}\) at the surfaces of both minerals and the reaction-controlling factors under a given set of conditions.
Only the replacement reactions are considered in this study. In other words, the reaction front is limited to the surfaces of A and B, and nucleation other than those at these sites is ignored. Although the proposed model is a one-dimensional model, many growing grains of newly precipitated minerals can be observed at the reaction surfaces if the model was applied to a natural three-dimensional rock. The grain boundaries would act as a conduit of intergranular fluid.
Furthermore, only the net-transfer reactions are considered, and exchange reactions are excluded. The intragrain diffusion in both minerals is assumed to be sufficiently slow to exclude the compositional changes within minerals. In other words, only congruent dissolutions are considered herein. Redissolution and reprecipitation of the newly precipitated minerals are assumed to be excluded from this study. This assumption is consistent with the considerably small degree of non-equilibrium observed for the newly precipitated minerals when compared with that observed for the dissolved minerals. Consequently, the newly precipitated minerals are excluded from the considered system at the same time of growth at the reaction front as that of the fractional crystallization; therefore, no compositional modification can be observed after growth.
Although the setting of two counter-positioned minerals interconnected through intergranular fluid has been considered in previous studies, the proposed model considerably differs from these earlier descriptions (Dohmen and Chakraborty 2003; Lasaga 1986). The differences are highlighted below.
In Lasaga (1986), the same pure phase dissolves at one side and precipitates at the other. Conversely, our model considers replacement reactions of solid solutions with different (sometimes similar) compositions at each side. This setting creates metamorphic textures with heterogeneous compositions among the different original minerals, providing important clues for elucidating the reaction mechanism and time scale of metamorphism.
Dohmen and Chakraborty (2003) considers the surface exchange reaction of elements and isotopes by incorporating the effect of intragrain diffusion. In geothermometry, geospeedmetry, and geochronology applications, their results describe the behaviors of relatively high-temperature metamorphic rocks, in which the effect of intragrain diffusion is important. In contrast, our model considers the replacement reactions and ignores the effect of intragrain diffusion. Therefore, it is more suitable for modeling low-temperature metamorphic rocks, particularly hydrated and altered rocks induced by geofluids.
Mathematical formulation
Neither of the two minerals (A and B) is equilibrated with the adjacent fluid. Such a deviation from equilibrium is driven by the dissolution of the minerals. The precipitated solid-solution minerals \(\mathrm {A}_{X_{\alpha }} \mathrm {B}_{1-X_{\alpha }}\) are assumed to be different from the unstable minerals A and B. Even in special cases when \(X_{\alpha }=1\) and \(X_{\alpha }=0\), the solid-solution mineral differs from the unstable minerals A and B.
The following reactions occur on the surfaces of minerals A and B, respectively:
where \(X_{\alpha }^{{\mathrm{A}}}\) and \(X_{\alpha }^{{\mathrm{B}}}\) represent the molar fractions of component \(\alpha\) in the newly precipitated minerals on the surfaces of A and B, respectively. The second term on the right side of each reaction describes the material transfer associated with these replacements. The overall reaction is expressed as a linear combination of the above reactions. Assuming a closed system, the overall reaction is given by
where the stoichiometric coefficients are derived from the mass-balance constraints. The solid-solution minerals of the first and second terms on the right-hand side precipitated at sides A and B, respectively.
We first consider the compositions of the newly precipitated minerals. In this binary model, we assume that \(\alpha\) and \(\beta\) share the same coefficient of the equilibrium abundance ratio of the precipitated component in the intergranular fluid to the precipitated components in the mineral (i.e., \(K \equiv K_{\alpha } = K_{\beta })\). This ensures that \(C_{\alpha }\) and \(C_{\beta }\) are completely coupled (see Appendix A for details). Hereafter, the equilibrium formulations will be expressed in terms of \(C_{\alpha }\) alone. Local equilibrium is assumed between the newly precipitated mineral and the surrounding fluid. Therefore, the chemical equilibrium constraint at each side of minerals A and B can be, respectively, written as
where \(C_{\alpha }^{{\mathrm{A}}}\) and \(C_{\alpha }^{{\mathrm{B}}}\) denote the concentrations of the components \(\alpha\) and \(\beta\) at the surfaces of minerals A and B, respectively.
Second, we describe the dissolution kinetics of the unstable minerals A and B. According to Lasaga (1986), the reaction rate is assumed to be proportional to the n-th power of the deviation of the fluid compositions from the equilibrium compositions. Hence, the dissolution rate laws of each mineral can be written as
where \(R_{{\mathrm{A}}}\) and \(R_{{\mathrm{B}}}\) denote the dissolution rates of minerals A and B, respectively; n denotes the order of the reactions, and \(k_{{\mathrm{A}}}\) and \(k_{{\mathrm{B}}}\) denote the dissolution rate constants of A and B, respectively. The latter expression in Eq. (2b) is obtained using Eq. (20) in Appendix A. Under these rate laws, minerals A and B cannot dissolve if the concentration of the adjacent fluid is the equilibrium concentration of the species \(\alpha\) and \(\beta\). For simplicity, our replacement model assumes equality of the precipitation rate and the dissolution rate. In this binary model, a local equilibrium is assumed between the precipitated mineral and the adjacent fluid, whereas a non-equilibrium condition is adopted between the dissolved mineral and the fluid. Generally, this assumption is inconsistent, and the local equilibrium is considered to be inadequate for describing a solid solution. However, in our assumed binary component system, the precipitated compositions are equal to the equilibrium compositions, which are obtained using Eq. (1). This hypothesis can be explained using the equilibrium concept and kinetics of the solid solution–aqueous solution (SS–AS) system (Astilleros et al. 2003; Glynn and Reardon 1990; Lippmann 1980); however, this is beyond the scope of the current study. The dissolutions at the surfaces of minerals A and B form concentration gradients in the fluid channel. According to Fick’s law, these concentration gradients drive the diffusion fluxes of \(\alpha\) and \(\beta\) to or from the mineral surfaces. Assuming steady state and identical diffusion coefficients of the components \(\alpha\) and \(\beta\) in the intergranular fluid, (i.e., \(D^{{\text {eff}}} \equiv D_{\alpha }^{{\text {eff}}} = D_{\beta }^\text{eff}\)), the diffusion fluxes are linear and coupled (see Appendix A for details), and are given by
where \(C_{\alpha }^{{{\text{A}}}}\) and \(C_{\alpha }^{{{\text{B}}}}\) denote the concentrations of the components \(\alpha\) at the surfaces of minerals A and B, respectively. There is no reaction within the fluid conduit that influences the linear concentration gradients. This can be concluded based on the assumption that reactions occur only at the surface of the dissolved minerals A and B to ensure the exclusion of the newly precipitated minerals from the system at the same time of growth as that of fractional crystallization. As an example, Fig. 1 shows the concentration profiles of the \(\alpha\) and \(\beta\) components in the fluid-filled channel.
Modeling results
The governing equations and non-dimensional parameters
As described above, the \(\alpha\) and \(\beta\) components are completely coupled; thus, we express our equations in terms of the component \(\alpha\) in both cases. The mass-balance equations of the \(\alpha\) component at the side of each mineral are given by
Summing Eqs. (4a) and (4b) at each mineral side, we obtain
which gives the mass-balance relation of the overall reaction and the closed-system behavior. Substituting Eqs. (1)–(3) into the mass-balance relations (Eq. 4), the non-dimensional governing equations are obtained as
where the non-dimensional parameters \(\gamma _{{{\rm A}}}\), \(\gamma _{{\rm B}}\), and \(\delta\) govern the behavior of the system. They are, respectively, defined as
The parameters \(\gamma _{{{\rm A}}}\) and \(\gamma _{{{\rm B}}}\) dictate the relative balance between the reaction rates on the surfaces of minerals A and B, respectively, and also the transport rates in the fluid. The parameter \(\delta\) indicates the ratio of the kinetic dissolution constants of minerals A and B. These equations and parameters govern the behavior and the reaction mechanism in the system. Notably, only two out of these three equations or parameters are independent.
Even by inspection alone (without solving), Eqs. (6) and (7) reveal the following important characteristics of the system. The effects of equilibrium partitioning, diffusion rates, interface kinetics, and system geometry are not completely separable in general, and the behavior of the system is characterized by certain ratios instead of the absolute values of the parameters, i.e., the relative values are important in this system.
In the following subsection, the effects of the parameters on the system behavior will be examined for \(n=1\). In this case, Eq. (6) can be easily solved analytically, giving the following compositions of the precipitated minerals:
The reaction rates and concentrations are also determined by the non-dimensional governing parameters, \(\gamma _{{{\rm A}}}\), \(\gamma _{{{\rm B}}}\), and \(\delta\).
The kinetic regimes
The reaction system may be classified into different types based on the behavior and the reaction mechanism of the system. The compositions of the newly precipitated minerals on both sides, the concentration gradients in the intergranular fluid, and the rate-determining process of the overall reaction, are considered as significant characteristics that depend on the values of the parameters \(\gamma _{{{\rm A}}}\), \(\gamma _{{{\rm B}}}\), and \(\delta\).
The \(\gamma _{{{\rm A}}}\)−\(\gamma _{{{\rm B}}}\) plot (Fig. 2) is a reaction mechanism map for predicting the reaction mechanism in a given system. The map marks the regions in the \(\gamma _{{{\rm A}}}\)−\(\gamma _{{{\rm B}}}\) space in which each kind of behavior occurs. Figure 3 depicts a representative concentration profile of the composition of \(\alpha\) in each region. First, we describe the cases for \(\delta =1\), \(k_{{{\rm A}}}=k_{{{\rm B}}}\), and we describe the cases for \(\delta \ne 1\). The characteristics of the behavior for each reaction type can be described as follows.

A reaction mechanism map denoting the reaction mechanisms and the behavior of the system as a function of two dimensionless parameters, \(\gamma _{{{\rm A}}}\) and \(\gamma _{{{\rm B}}}\). The map marks the regions in the \(\gamma _{{{\rm A}}}\)−\(\gamma _{{{\rm B}}}\) space in which different behaviors can be observed. The contours of \(X_{\alpha }^{{{\rm A}}}\) (red lines) and \(X_{\alpha }^{{{\rm B}}}\) (blue lines) are also presented. The broken lines are the contours of the dimensionless parameter \(\delta\) that represent the ratio of \(k_{{\rm A}}\) to \(k_{{{\rm B}}}\)

The concentration profiles of the \(\alpha\) component (green line) for various sets of the governing parameters \(\gamma _{{{\rm A}}}\) and \(\gamma _{{{\rm B}}}\). The horizontal axis of each graph depicts the one-dimensional spatial coordinate of the modeling system, where minerals A and B occupy the left and right sides, respectively. The vertical axis is the concentration of the \(\alpha\) component from zero to the coefficient of the equilibrium abundance ratio K. Because the concentration \(C_{\alpha }\) is linearly related to the mineral composition \(X_{\alpha }\) by Eq. (1), the values on each side of the graph correspond to the compositions of the precipitated mineral, where the scale of the vertical axis ranges from 0 to 1. The red and blue circles refer to \(X_{\alpha }^{{{\rm A}}}\) and \(X_{\alpha }^{{{\rm B}}}\), respectively. The parameter set \((\gamma _{{{\rm A}}}, \gamma _{{{\rm B}}})\) for each compositional profile is set to \((10^{-2}, 10^{2})\), \((1, 10^{2})\), \((10^{2}, 10^{2})\); \((10^{-2}, 1)\), (1, 1), \((10^{2}, 1)\); \((10^{-2}, 10^{-2})\), \((1, 10^{-2})\), \((10^{2}, 10^{-2})\), from left to right row by row
Cases for \(\delta =1\)
In the case of \(\delta =1\) (anti-diagonal region of the mechanism map), the non-dimensional parameters \(\gamma _{{{\rm A}}}\) and \(\gamma _{{{\rm B}}}\) are identical, and are defined as \(\gamma (\equiv \gamma _{{{\rm A}}}=\gamma _{{{\rm B}}})\). Figure 4 illustrates the compositions of the precipitated minerals on the A and B sides as functions of \(\gamma\). In this case, the reaction rates \(R_{{{\rm A}}}\) and \(R_{{{\rm B}}}\) become identical and are labeled as R hereafter. The relation of the reaction rate R to \(\gamma\) is depicted in Fig. 5.

The compositions of the precipitated minerals on the A and B sides as functions of \(\gamma\) when \(\delta =1\). The solid red and blue dashed lines indicate \(X_{\alpha }^{{{\rm A}}}\) and \(X_{\alpha }^{{{\rm B}}}\), respectively. In case of small and large \(\gamma\), the compositions of the precipitated minerals are considered to be homogeneous and heterogeneous, respectively

The plot of the reaction rate as a function of \(\gamma\) when \(\delta =1\). In this case, the reaction rates \(R_{{\rm A}}\) and \(R_{{{\rm B}}}\) are observed to be equivalent. For small \(\gamma\), the rate is independent of \(\gamma\) and is only dependent on k and K, indicating that it is surface-controlled. However, for large \(\gamma\), the rate depends on k, K, and D, indicating a combined surface reaction and diffusion control (see text)
In the case of \(\gamma<<1\) (lower left corner region of the mechanism map), the compositions of the newly precipitated minerals become
where the arrow symbol “\(\rightarrow\)” indicates the convergence of the variable on the left-hand side to the value on the right-hand side; and \(+\,0\) and \(-\,0\) on the right-hand side indicate that the converged value has a little larger and smaller than the value on the right-hand side, respectively. These values are the center values of the end-member compositions of A and B.
The overall reaction rate and flux become
The overall reaction depends only on the rate of the surface process, i.e., the reaction is surface-controlled. Further, the material exchanges between the two reaction sites are not limited by the diffusive transportability; therefore, they are very active. In accordance with the homogeneous mineral compositions (Eq. 9), the concentration gradient is extremely gentle or almost flat (Fig. 3). It is important to note that a gentle concentration gradient is achieved by a high material transportability relative to the surface dissolution. Consequently, the whole system is approximately homogeneous. In this case, the compositions of the newly precipitated minerals are considered to be equilibrated with each other in the whole system.
In case of \(\gamma \sim 1\) (the central region of the mechanism map), as \(\gamma\) increases, transition gradually occurs from the homogeneous system, where the material exchanges are very active, to the heterogeneous system, where the material exchanges are very poor. The concentration gradient is moderately steep (Fig. 3). In this transition zone, the rate-determining process involves both surface reactions as well as intergranular diffusion, as depicted in Fig. 5.
When \(\gamma\gg 1\) (the right upper corner region of the mechanism map), the compositions of the newly precipitated minerals can be given as follows:
The precipitated mineral on each side is almost identical to the reactant mineral because of the low transportability of the intergranular fluid.
The overall reaction rate and flux become
The overall reaction rate in the system is dependent not only on the diffusion in the fluid, but also on the surface reaction. Thus, the overall reaction is not diffusion-controlled but surface- and diffusion-controlled in a strict sense, as described in detail in the “Discussion” section. The material exchanges are limited by diffusion and are considerably poor relative to those in case of the surface-controlled system. In accordance with the heterogeneous mineral compositions (Eq. 11), the concentration profile is observed to be considerably steep (Fig. 3). Such a steep concentration gradient can be attributed to the low material transportability relative to surface dissolution. Therefore, the system is quite heterogeneous and out of equilibrium.
Cases for \(\delta \ne 1\)
Next, we describe only the cases of \(\delta<<1\) (\(\gamma _{{\rm A}} \ll \gamma _{{{\rm B}}}\): left upper triangle region of the mechanism map). In case of \(\delta \gg 1\) (\(\gamma _{{{\rm A}}} \gg \gamma _{{{\rm B}}}\): right lower triangle region of the mechanism map), the results can be obtained by just substituting A to B because our modeling is symmetric for A and B. The compositions of the newly precipitated minerals are denoted as red and blue contours in Fig. 2.
In case of \(\gamma _{{{\rm A}}}\ll 1\) and \(\gamma _{{{\rm B}}}\gg 1\) (left upper corner region of the mechanism map), the mineral compositions become
Further, the concentration profile is very flat (Fig. 3). The composition of the system is considerably homogeneous and approaches B. Additionally, the reaction rate is controlled by the surface dissolution of A. All these consequences are derived from the lack of the \(\alpha\) component, which is caused by the extreme slowness of the surface dissolution of A. The coupling effect of the intrinsically slow surface-reaction rate of A relative to intergranular diffusivity and the slow intergranular diffusivity relative to the surface-reaction rate of B hinder the surface dissolution of A.
In case of \(\gamma _{{{\rm A}}} \ll 1\) and \(\gamma _{{{\rm B}}} \sim 1\) (left middle region of the mechanism map), the behavior and the reaction mechanism are similar to the aforementioned case (\(\gamma _{{\rm A}}\ll 1\) and \(\gamma _{{{\rm B}}}\gg 1\)), except for the mineral compositions and the concentration of the intergranular fluid. The mineral compositions \(X_{\alpha }^{{{\rm A}}}\) and \(X_{\alpha }^{{{\rm B}}}\) and the concentration of the intergranular fluid are very similar to each other and to the above case; however, the values increase slightly (Fig. 3). This is caused by the increase in diffusive flux of the intergranular fluid when compared with that observed in case of \(\gamma _{{{\rm A}}}\ll 1\) and \(\gamma _{{\rm B}}\gg 1\), promoting the dissolution of surface A.
In case of \(\gamma _{{{\rm A}}} \sim 1\) and \(\gamma _{{{\rm B}}}\gg 1\) (central upper region of the mechanism map), the mineral composition of side B can be given as follows:
In contrast, the composition of side A changes from 0 to 1. As \(\gamma _{{{\rm A}}}\) increases, there is a gradual transition from the homogeneous system, where the material exchanges are extremely active, to the heterogeneous system, where the material exchanges are very poor, as illustrated in Fig. 2. Further, the concentration gradient is moderately steep (Fig. 3). The rate-determining process is the combined effect of the surface reactions and intergranular diffusion.
Discussion
Each region on the reaction mechanism map (Fig. 2) shows particular properties of the system, including the rate-limiting process and the amount of material transfer. By verifying the compositional heterogeneity of the natural and synthetic samples, these properties can be deduced, and the non-dimensional parameters can be approximately estimated. Subsequently, the non-dimensional parameters are determined by identifying the thermodynamic and kinetic parameters and the length scale to ensure that the behavior and mechanism of the system during metamorphism can be predicted in case of arbitrary systems. Especially, the rate-determining process is elucidated, which helps us to estimate the type of elementary processes and the time-scale of metamorphism.
Surface-reaction- and diffusion-controlled replacement reaction
The proposed model denotes that the rate-determining process is not the surface reaction but the surface reaction combined with diffusion control in the region, where \(\gamma\) is considerably higher than 1; thus, diffusivity is extremely smaller than the rate of the surface reaction. In general, the system becomes diffusion-controlled in an extreme situation when the diffusivity is very slow relative to the rate of the surface reaction. Previous studies, including those related to the steady diffusion model, which investigate coronae or other replacement textures, always considered diffusion-limited kinetics (e.g., Ashworth and Sheplev 1977; Joesten 1977; Nishiyama 1983). Lasaga (1986) clarified that the system is diffusion-controlled for a net-transfer reaction involving no solid solutions, when the diffusivity is considerably slow. Dohmen and Chakraborty (2003) also denoted that the diffusion in the intergranular fluid is the rate-determining process for an overall exchange reaction when the diffusivity is very slow, unless the intragrain diffusivity is very slow.
However, our modeling results demonstrate that the situation is complex. The replacement reactions involving the phases that exhibit solid solution behavior are not diffusion-limited, but surface and diffusion-controlled even if the diffusivity is extremely slower than the rate of surface reaction (Fig. 6a). This can be attributed to the composition of the solid solution, which increases the degrees of freedom in the system. If a replacement reaction does not involve solid solutions, the reaction at one side proceeds with the rate of material supply from the opposite side. In contrast, the replacement reaction rate involving solid solutions is not completely controlled by the rate of material supply from the other side. When the material transfer is not sufficiently fast to allow replacement of a newly precipitate phase, which consists of a component originating from the surface dissolution of the other side, the material of the newly precipitated phase is compensated by a component from the surface dissolution of the same side, resulting in an increase in the composition of the latter component. Therefore, the overall reaction rate is not completely controlled by diffusion, but by both the diffusion and surface reactions.
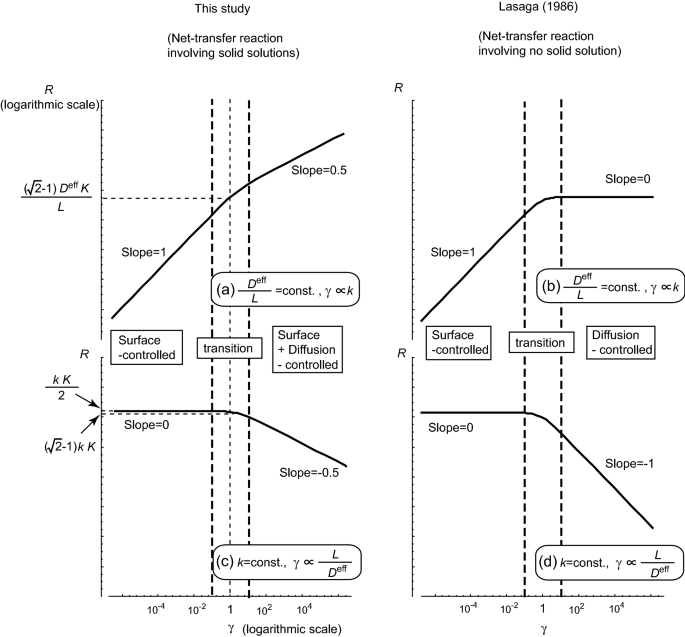
The double logarithmic plots of the reaction rates as a function of \(\gamma\) when \(\delta =1\). The results of this study for net-transfer reactions involving a solid solution are denoted in a and c. For comparison, the results of the case of net-transfer reactions that do not involve a solid solution (Lasaga 1986) are denoted in b and d. Upper: a and c denote the results for the case when \(D^{{\rm eff}}/L\) is constant to depict the dependency of the reaction rate R on the surface reaction rate constant k. Lower: b and d denote the results when k is constant to denote the dependency of R on the intergranular diffusion constant, \(D^{{\rm eff}}\). The slopes in the upper and lower graphs refer to k and \(L/D^{{\rm eff}}\), respectively, implying a controlled reaction process, which is written in the rectangular box
This newly obtained knowledge about the rate-limiting process can considerably influence the kinetic studies in petrology. Because the replacement reactions in natural systems usually involve solid solutions, it is necessary to consider the effect of both the surface reaction and diffusion to analyze them, even in cases in which diffusivity is sufficiently slower than the rate of the surface reaction. Especially, caution should be devoted to the time-scale estimation of a reaction–diffusion system. The effect of diffusion in the combined diffusion and surface-controlled systems is half of that in a simple diffusion-controlled system. In addition, the time-scale estimation is considerably affected by the factors that change the effective rate of the surface reaction, including the reactive surface area and the temperature.
Implications with respect to the reaction textures in metamorphic rocks
Using the proposed model, we can understand the behavior and the mechanism of the system that generates a variety of reaction textures, which can be observed in both natural and synthetic samples. Pseudomorphs and pseudomorph-like structures can be the direct evidence of replacement reactions (e.g., Vernon 2004). In some cases, the mineral assemblage, the mineral compositions, and the local bulk compositions of newly precipitated minerals are homogeneous even if they replace different host minerals, resulting in difficult recognitions of the original boundary of the host minerals. In contrast, the mineral assemblage, mineral compositions, and local bulk composition of the newly precipitated minerals are different from each other for different types of dissolving host minerals (e.g., Centrella et al. 2015; Kuwatani and Toriumi 2008; Yang 2004; Yang et al. 2004).
The contrasting types of the reaction textures are considered to be derived from different reaction mechanisms of the system. The former homogeneous reaction textures correspond to the case of \(\gamma\ll 1\), where the system is homogeneous and there is sufficiently high diffusivity of related chemical species in the intergranular fluid, resulting in a surface-reaction-controlled system. This is consistent with the classical view of metamorphic petrology that assumes a global equilibrium, excluding unstable relict minerals in the rock. In this case, geothermobarometry can be used to accurately estimate the P–T condition under which the replacement reactions occurred if the chemical compositions of the newly precipitated minerals are only used and the dissolving minerals are excluded.
The latter heterogeneous reaction texture corresponds to that observed in the case when \(\gamma\gg 1\); the system is heterogeneous because of low diffusivity of dissolved species in the intergranular fluid. The system is both surface-reaction- and diffusion-controlled. The heterogeneity of the constituting minerals and their compositions indicate that the system is not equilibrated as a whole but only locally equilibrated around each original host mineral. In the locally equilibrated system, where the intergranular fluid is zoned for the concentrations of dissolved species, the mineral compositions (even rim compositions) may not be applicable for estimation of P–T conditions.
The variety in the reaction textures corresponds to a variety of reaction mechanisms in the system, and it is obtained from variations of the \(\gamma\) parameter in natural systems as a scale of at least several orders of magnitude. If we consider both metamorphic and metasomatic reactions under crustal levels, the variations in only three parameters, k, K, and L, cannot be attributed to the extensive range of variations of \(\gamma\) because the temperature conditions and the grain sizes of the reactant minerals are not considered to be so large. However, the effective diffusivity is known to vary in several orders of magnitude according to the amount and distribution of the intergranular fluid (e.g., Brady 1983; Rubie 1986).
The effective diffusion coefficient of any given component can be given as follows:
where \(\tau\) denotes the tortuosity factor, \(\phi\) denotes the volume fraction of interconnected porosity, and D denotes the diffusion coefficient in a hypothetical volume consisting entirely the intergranular medium (Nakashima 1995). If the fluid porosity is interconnected, the intergranular diffusivity can be determined by the diffusion within the pore water, and the diffusion coefficient ranges approximately from \(10^{-10}\) to \(10^{-6}\) (\(\hbox {m}^2\)/s) for cations of the major components under crustal temperatures. If the fluid channels are not interconnected, the intergranular diffusion rate is determined by the grain–boundary diffusion. This grain–boundary diffusion is enhanced by the presence of a fluid (e.g., Carlson 2002; Nakashima 1995; Rubie 1986). For cases from “dry ”, “partially wet” to “wet”, the diffusion coefficients vary up to ten orders of magnitude, ranging approximately from \(10^{-20}\) to \(10^{-10}\) (\(\hbox {m}^2\)/s) (Nakashima 1995).
The large variations in the effective diffusivity \(D^{{\rm eff}}\), which are derived from the distribution and behavior of the intergranular fluids, are considered to be the main cause of the large variation in the non-dimensional governing parameter \(\gamma\). When the amount of intergranular fluid is sufficient, the high transportability of intergranular diffusion results in a considerably low \(\gamma\), which makes a system homogeneous and surface-reaction-controlled. However, when the amount of intergranular fluid is insufficient, \(\gamma\) is so high that the system becomes heterogeneous and surface-reaction- and diffusion-controlled.
Limitations of the model and future studies
In a net-transfer reaction, the surfaces of the minerals or the reaction sites inevitably move as the reaction progresses. However, we consider the constant distance L between the two minerals in our model. This fixed-boundary assumption is appropriate as a first-order approximation only in case of the assumption of \(R \cdot \Delta t\ll L\) and the steady state. To trace the time-dependent evolution of the reaction behavior, the effects of the moving boundaries due to dissolution should be incorporated. This so-called “moving-boundary problems” will be discussed in future studies.
Our model only incorporates the replacement reactions at the surfaces of the two minerals and excludes other possibilities, including the exchange reaction, nucleation, and precipitation, occurring at other locations. The redissolution and reprecipitation of the newly precipitated minerals are also excluded. However, the reaction type and the locations at which the reaction occurs are unknown in natural systems. In case that \(\gamma\) is considerably small, material transportability is considerably high to ensure that the required or discarded elements can be sufficiently supplied to or removed from the reaction site, respectively. In such a case, the reaction processes, such as nucleation, dissolution, or precipitation, are observed to occur at the most kinetically preferred locations. Hence, other type of reactions (for example, the porphyroblast-forming reaction and the multi-layered-corona-forming reaction) other than replacement may proceed in a real natural system. Although it is beyond the scope of this study, the extension of our binary component model to the multi-component multi-phase systems will make it possible to develop a new kinetic method of metamorphic reactions in natural systems based on the concept of the equilibrium and kinetics of the SS–AS system (e.g., Astilleros et al. 2003; Glynn and Reardon 1990; Lippmann 1980).
Availability of data and materials
All data can be generated easily from the equations in this study, because the present model is theoretical.
References
Ashworth JR, Sheplev VS (1977) Diffusion modelling of metamorphic layered coronas with stability criterion and consideration of affinity. Geochim Cosmochim Acta 61(17):3671–3689. https://doi.org/10.1016/S0016-7037(97)00190-7
Astilleros JM, Pina CM, Fernandez-Diaz L, Putnis A (2003) Supersaturation functions in binary solid solution–aqueous solution systems. Geochim Cosmochim Acta 67(9):1601–1608
Brady GE (1983) Intergranular diffusion in metamorphic rocks. Am J Sci 283A:181–200
Carlson WD (2002) Scales of disequilibrium and rates of equilibration during metamorphism. Am Mineral 87:185–204. https://doi.org/10.2138/am-2002-2-301
Centrella S, Austrheim H, Putnis A (2015) Coupled mass transfer through a fluid phase and volume preservation during the hydration of granulite: an example from the Bergen Arcs, Norway. Lithos 236–237:245–255
Dohmen R, Chakraborty S (2003) Mechanism and kinetics of element and isotopic exchange mediated by a fluid phase. Am Mineral 88(8–9):1251–1270. https://doi.org/10.2138/am-2003-8-908
Glynn PD, Reardon EJ (1990) Solid-solution aqueous-solution equilibria: thermodynamic theory and representation. Am J Sci 290:164–201
Joesten R (1977) Evolution of mineral assemblage zoning in diffusion metasomatism. Geochim Cosmochim Acta 41(5):649–670. https://doi.org/10.1016/0016-7037(77)90303-9
Kuwatani T, Toriumi M (2008) Rehydration metamorphism of the iratsu eclogite mass in the Sambagawa metamorphic belt, Japan. In: Proceedings of the AGU fall meeting
Kuwatani T, Toriumi M (2017) Thermodynamic forward modeling of retrogressive hydration reactions induced by geofluid infiltration. Earth Planets Space 69:18
Lanari P, Engi M (2017) Local bulk composition effects on metamorphic mineral assemblages. Rev Mineral Geochem 83:55–102
Lasaga AC (1986) Metamorphic reaction-rate laws and development of isograds. Miner Mag 50(357):359–373. https://doi.org/10.1180/minmag.1986.050.357.02
Lasaga AC (1998) Kinetic theory in the earth sciences. Princeton University Press, Princeton
Lippmann F (1980) Phase diagrams depicting aqueous solubility of binary mineral systems. N Jb Miner Abh 139:1–25
Nakashima S (1995) Diffusivity of ions in pore-water as a quantitative basis for rock deformation rate estimates. Tectonophys 245(3–4):185–203. https://doi.org/10.1016/0040-1951(94)00234-Z
Nishiyama T (1983) Steady diffusion-model for olivine-plagioclase corona growth. Geochim Cosmochim Acta 47(2):283–294. https://doi.org/10.1016/0016-7037(83)90141-2
Okamoto A, Toriumi M (2005) Progress of actinolite-forming reactions in mafic schists during retrograde metamorphism: an example from the sanbagawa metamorphic belt in central shikoku, Japan. J Metamorph Geol 23(5):335–356
Rubie DC (1986) The catalysis of mineral reactions by water and restrictions on the presence of aqueous fluid during metamorphism. Miner Mag 50(357):399–415. https://doi.org/10.1180/minmag.1986.050.357.05
Thompson AB, Rubie DC (eds) (1985) Metamorphic Reactions. Kinetics, Textures and Deformation. Advances in Physical Geochemistry Series Vol 4. Springer-Verlag, Berlin
Vernon R (2004) A practical guide to rock microstructures. Cambridge University Press, Cambridge
Yang TN (2004) Retrograded textures and associated mass transfer: evidence for aqueous fluid action during exhumation of the Qinglongshan Eclogite, Southern Sulu ultrahigh pressure metamorphic terrane, Eastern China. J Metamorph Geol 22(7):653–669
Yang TN, Xu ZQ, Leech M (2004) Mass balance during retrogression of eclogite-facies minerals in the Rongcheng Eclogite, Eastern Sulu ultrahigh-pressure terrane, China. Am Mineral 89(10):1525–1532
Acknowledgements
We would like to thank Prof. T. Nishiyama and an anonymous reviewer for providing constructive comments.
Funding
This work was funded by JST PRESTO (Grant Number JPMJPR1676) and JST CREST (Grant Number JPMJCR1761), JSPS KAKENHI (Grant Number JP19K04027), and the Cooperative Research Program of the Earthquake Research Institute, University of Tokyo (2018-B04).
Author information
Authors and Affiliations
Contributions
Conceptualization, methodology: TK. Funding acquisition: TK and MT. Supervision, project administration: MT. Both authors read and approved the final manuscript.
Corresponding author
Ethics declarations
Competing interests
The authors declare no that they have no competing interests. The funders had no role in the design of the study; in the collection, analyses, or interpretation of data; in the writing of the manuscript, or in the decision to publish the results.
Additional information
Publisher’s Note
Springer Nature remains neutral with regard to jurisdictional claims in published maps and institutional affiliations.
Appendix A: Coupled behavior of the \(\alpha\) and \(\beta\) components
Appendix A: Coupled behavior of the \(\alpha\) and \(\beta\) components
From the balance of chemical potential at the equilibrium state between aqueous solution and solid solution, the equilibrium constants, \(K_{\alpha }^{{\rm eq}}\) and \(K_{\beta }^{{\rm eq}}\), can be written as the ratio of activity:
where \(\kappa\) indicates the activity coefficient; subscripts indicates the component; and superscripts “\(\text fluid\)” and “\(\text mineral\)” indicate the phase in which the component exists. \(C_{\alpha }\) and \(C_{\beta }\) denote the concentrations of the \(\alpha\) and \(\beta\) components in the intergranular fluid, respectively; \(X_{\alpha }\) and \(X_{\beta }\) denote the mole fraction of the \(\alpha\) and \(\beta\) components in the solid solution, respectively. The equilibrium constants, \(K_{\alpha }^{{\rm eq}}\) and \(K_{\beta }^{{\rm eq}}\), correspond to the solubility products of the solid solution end-members [see the description about equilibrium in solid solution–aqueous solution system (Glynn and Reardon 1990; Lippmann 1980)]. If we assume ideal behavior of components \(\alpha\) and \(\beta\) within both of mineral and fluid, all the above activity coefficients become constant. By defining a new kind of constant parameters, \(K_{\alpha } \equiv (\kappa _{\alpha }^{{\rm mineral}} / \kappa _{\alpha }^{{\rm fluid}}) \cdot K_{\alpha }^{{\rm eq}}\) and \(K_{\beta } \equiv (\kappa _{\beta }^{{\rm mineral}} / \kappa _{\beta }^{{\rm fluid}}) \cdot K_{\beta }^{{\rm eq}}\), compositions of the newly precipitated mineral and concentration of the surrounding fluid can be related by the following equations:
where \(K_{\alpha }\) and \(K_{\beta }\) are the coefficients of the equilibrium abundance ratio of the \(\alpha\) and \(\beta\) components within the intergranular fluid to those within the solid solution mineral, respectively.
Because minerals A and B have end-member compositions (\(X_{\alpha }=1\) and \(X_{\beta }=1\)), the equilibrium fluid concentrations to minerals A and B can be represented as follows:
where \(C_{\alpha , \mathrm{eq}}^{{{\rm A}}}\) and \(C_{\beta , \mathrm{eq}}^{{\rm B}}\) denote the equilibrium fluid concentration in minerals A and B, respectively.
In this binary model, we assume that \(\alpha\) and \(\beta\) exhibit identical properties, yielding
From Eqs. (17)–(19), we obtain
and
The aforementioned three equations suggest that \(C_{\alpha }\) and \(C_{\beta }\) are completely coupled. Therefore, we use only \(C_{\alpha }\) for obtaining the formulations in the main text.
Based on the assumption of the steady state, the diffusion fluxes are linear and given by the following reactions:
where \(C_{\alpha }^{{{\rm A}}}\), \(C_{\alpha }^{{{\rm B}}}\), \(C_{\beta }^{{\rm A}}\), and \(C_{\beta }^{{{\rm B}}}\) denote the concentrations of the \(\alpha\) and \(\beta\) components at the surfaces of minerals A and B, respectively, and \(D_{\alpha }^{{\rm eff}}\) and \(D_{\beta }^{{\rm eff}}\) denote the diffusion coefficients of the \(\alpha\) and \(\beta\) components in the intergranular fluid. Again, we assume that the diffusion property of \(\alpha\) and \(\beta\) are identical, which yields
Substituting Eqs. (20b) and (23) into Eq. (22), we obtain
suggesting that the diffusions of \(\alpha\) and \(\beta\) in the fluid are completely coupled.
Rights and permissions
Open Access This article is licensed under a Creative Commons Attribution 4.0 International License, which permits use, sharing, adaptation, distribution and reproduction in any medium or format, as long as you give appropriate credit to the original author(s) and the source, provide a link to the Creative Commons licence, and indicate if changes were made. The images or other third party material in this article are included in the article's Creative Commons licence, unless indicated otherwise in a credit line to the material. If material is not included in the article's Creative Commons licence and your intended use is not permitted by statutory regulation or exceeds the permitted use, you will need to obtain permission directly from the copyright holder. To view a copy of this licence, visit http://creativecommons.org/licenses/by/4.0/.
About this article

Cite this article
Kuwatani, T., Toriumi, M. Simple kinetic model for replacement reactions involving solid solutions: the significant role of geofluids. Earth Planets Space 72, 8 (2020). https://doi.org/10.1186/s40623-020-1135-2
Received:
Accepted:
Published:
DOI: https://doi.org/10.1186/s40623-020-1135-2