- Full paper
- Open access
- Published:
Wavelet-based verification of a relative paleointensity record from the North Pacific
Earth, Planets and Space volume 71, Article number: 88 (2019)
Abstract
We present a relative paleointensity (RPI) record for the last ~ 1.1 Myr estimated from a sediment core in the central North Pacific, with quality verification using wavelet analysis. Rock magnetic analysis reveals that a stable remanence is carried mainly by single-domain (SD) biogenic magnetite and pseudo-SD detrital magnetite and that concentration- and grain-size-related bulk magnetic parameters vary by a factor of 3, initially meeting a conventional standard for RPI estimation. However, a further test using wavelet spectra of RPI proxies normalized by anhysteretic remanent magnetization (ARM) or isothermal remanent magnetization (IRM) shows intermittent orbital contamination at period of 100 kyr. A part of the 100-kyr orbital frequency in ARM-normalized RPI has a coherence and physical relationship with the normalizer. For the same time interval, a prominent 100-kyr cycle in the ARM/IRM wavelet spectra is also coherent with RPI, indicating that relative changes in biogenic and detrital magnetite were not well compensated by ARM normalization. For the selected RPI proxy using IRM normalization, a significant physical relationship with the lithology of magnetic minerals was not detected in the wavelet analysis, and thus, its intermittent orbital cycles could be of climatic origin, probably induced by non-magnetic factors. Nevertheless, our RPI record is consistent with global RPI stacks and provides a successful reconstruction of paleointensity with geomagnetic field origin in the North Pacific.
Introduction
Temporal variations in geomagnetic paleointensity are fundamental for understanding the geodynamo process and have therefore been closely investigated via geological materials such as rocks and sediments (e.g., Tric et al. 1992; Laj et al. 2000; Channell et al. 2014). In particular, relative paleointensity (RPI) values recorded in sedimentary sequences provide insights into the long-term variations in the geomagnetic field and show a global coherency over millennial timescales despite environmental differences and possible physical uncertainties of the recording process (e.g., Tauxe et al. 2006; Roberts et al. 2013). With increasing numbers of well-constrained long RPI records, time-varying paleointensity records have been integrated into global models, which now extended through the entire Quaternary (e.g., SINT-800: Guyodo and Valet 1999; SINT-2000: Valet et al. 2005; EPAPIS-3Ma: Yamazaki and Oda 2005; PISO-1500: Channell et al. 2009; PADM2M: Ziegler et al. 2011). Such globally stacked RPI data have a practical advantage in constraining sedimentary chronology, particularly for marine or lake environments that lack carbon or oxygen isotope dating (Roberts et al. 2013). However, high-quality RPI records from various geographic locations are still necessary to improve and evaluate the global models. In recent decades, few RPI records from the North Pacific (e.g., Kent and Opdyke 1977; Roberts et al. 1997; Yamazaki 1999) have contributed to the global stacks for the past 2 Myr, including SINT-2000 and PADM2M. These North Pacific RPIs, covering relatively short periods of geological time (< 0.9 Myr), are also insufficient for understanding the longer-term behavior of the geomagnetic field. Although a longer RPI record for the time interval of ~ 0.35–1.60 Ma has been documented (Yamazaki and Kanamatsu 2007), this record is not included in any of the global stacks.
Previous studies have discovered ~ 40-kyr or ~ 100-kyr cycles from the North Pacific RPI records, using spectral or wavelet analyses, suggesting orbital forcing of geomagnetic field variations (Kent and Opdyke 1977; Yamazaki 1999; Yokoyama and Yamazaki 2000; Yamazaki and Kanamatsu 2007; Yokoyama et al. 2007). Searches for orbital periods in paleointensity have also been performed for high-resolution and globally stacked RPI signals such as SINT-800, SINT-2000, and PISO-1500 (e.g., Heslop 2007; Channell et al. 2009), as well as deep-sea floor magnetization records and beryllium production records (e.g., Thouveny et al. 2008; Saracco et al. 2009). Some studies have suggested relationships between orbital signals and paleomagnetic intensity and directional changes (e.g., Fuller 2006; Thouveny et al. 2008), but no statistically significant orbital periods have been detected from global RPI stack records (e.g., Heslop 2007; Channell et al. 2009; Ziegler et al. 2011).
Xuan and Channell (2008) found that intermittent orbital cycles in some local RPI records are due to lithological or climatic contamination. Because the origin of such orbital cycles can be connected to lithological variations of magnetic minerals, the coherence between RPI and magnetic parameters including the normalizer used in RPI estimation has also been tested (e.g., Yamazaki and Kanamatsu 2007; Xuan and Channell 2008). In particular, in the case of marine sediments containing a mixture of biogenic and detrital magnetites, the different physical properties of these magnetites could result in coherence between RPI and the normalizer owing to incomplete normalization (Roberts et al. 2013), thereby complicating the record of paleointensity (Ouyang et al. 2014). However, such possible contamination of RPI from the two magnetite assemblages has not been fully assessed. The wavelet method is a useful way of detecting periodicities in non-stationary time series, including geomagnetic records (e.g., Guyodo et al. 2000; Heslop 2007; Xuan and Channell 2008; Channell et al. 2009), compared with power spectral analysis without time resolution. In addition, cross-wavelet analysis and wavelet coherence provide a powerful test for a physical link between two time series (Torrence and Compo 1998; Torrence and Webster 1999; Grinsted et al. 2004) and have been applied in investigating the presence of a phase relationship between RPI records and sedimentary lithologies (e.g., Guyodo et al. 2000; Xuan and Channell 2008). For example, Guyodo et al. (2000) were the first to analyze the cross-wavelet powers and phases of RPI versus rock magnetic records and proved a secondary lithological overprint on the RPI record.
In this study, we present a high-quality RPI record for the last ~ 1.1 Myr from the Hess Rise in the North Pacific, verified using wavelet analysis. We test for the possible existence of orbital cycles on the RPI proxies and evaluate wavelet coherence with magnetic parameters, including the normalizer for RPI estimation. Then, the best RPI estimate is determined and further tested for a possible physical relationship with lithological changes in magnetic properties. Finally, the obtained RPI record is compared with global stacks and other records from near the study area.
Sampling and methods
Sampling
A 7-m-long sediment core, NPGP1401-2A, was recovered from the abyssal basin just south of the Hess Rise (32.03°N, 178.59°E; 5205 m water depth) in the North Pacific (Fig. 1). The core was split longitudinally in two, and the working half was subsampled for this study. The sediments are composed of brown to dark yellowish homogeneous mud (silt and clay). A total of 322 discrete samples were sequentially taken from along the half-core with a regular ~ 2 cm span, using 7 cm3 plastic cubes.

Measurements
Magnetic susceptibility was measured for all of the prepared samples using a Bartington MS2 magnetometer, and mass-normalized susceptibility (χ) was calculated by wet mass. Measurements of the natural remanent magnetization (NRM) and subsequent stepwise alternating field (AF) demagnetization were carried out at AFs of 5, 10, 15, 20, 25, 30, 40, 50, 70, and 90 mT, using a cryogenic magnetometer system (2G Enterprises model 760R) interfaced with an in-line AF demagnetizer located in a magnetically shielded room. AF demagnetization data were analyzed using PuffinPlot (Lurcock and Wilson 2012). Demagnetization data for each sample were displayed on a vector diagram, and the characteristic remanent magnetization (ChRM) was isolated using principal component analysis (PCA; Kirschvink 1980) with a line-fitting method involving anchoring at the origin. The quality of the ChRM direction was evaluated using the maximum angular deviation (MAD), calculated from the difference between the anchored line and demagnetization data.
After demagnetization experiments, all samples were subjected to the acquisition of laboratory-induced magnetization of anhysteretic remanent magnetization (ARM) and isothermal remanent magnetization (IRM). ARM was acquired by applying a direct current (DC) field of 0.05 mT superimposed on a peak AF of 100 mT. A DC field of 1 T was applied to saturate the remanence (IRM1T) using an ASC Scientific IM-10 impulse magnetizer. Subsequently, both ARM and IRM were stepwise demagnetized in a peak AF of up to 50 mT with a 10 mT increment. The laboratory-induced magnetizations and their AF demagnetizations were used as normalizers to calculate RPI by ratios (NRM/normalizer) and by the so-called pseudo-Thellier method (Tauxe et al. 1995), respectively.
ARM and IRM1T were used as concentration-dependent magnetic parameters after mass normalization; ARM was normalized to a DC field of 0.05 mT (= 39.79 A/m) to calculate the mass-normalized ARM susceptibility (χARM). IRM1T was reacquired and then applied at 0.3 T in the opposite direction to obtain IRM− 300mT. S-ratios were calculated as S300 = 0.5 × (1 − IRM− 300mT/IRM1T). Values of S-ratio close to 1 are regarded as indicating a relative abundance of low-coercivity magnetic minerals such as magnetite (Bloemendal et al. 1992). To determine the grain size of magnetic minerals and their assemblages, hysteresis and first-order-reversal curve (FORC) analyses were performed on selected freeze-dried samples using a Princeton Measurement Corporation vibrating sample magnetometer (MicroMag 3900 VSM). Hysteresis parameters were obtained from 33 hysteresis curves, including the bulk coercive force (Bc), the remanent coercive force (Bcr), the saturation magnetization (Ms), and the saturation remanence (Mrs). Bcr values were obtained from backfield measurements. For 10 selected samples, 156 FORCs were measured with a field increment of 1.5 mT up to a maximum applied field of 1 T. FORC data were processed with the FORCinel software package (Harrison and Feinberg 2008) using the VARIFORC built-in function for variable smoothing described by Egli (2013).
Relative abundances of Ba and Ti were measured using an ITRAX X-ray fluorescence (XRF) core scanner. The XRF measurements were made at a resolution of 0.5 cm for the archive half of the core, and five-point moving averages for the obtained data were used to calculate the Ba/Ti ratio.
Wavelet analysis
To detect the presence of orbital periods in time series for magnetic variations, (local) wavelet power spectra (WPS) were analyzed using the Morlet wavelet following Torrence and Compo (1998) and Grinsted et al. (2004). WPS can identify significant orbital powers in time–frequency space. In addition, to identify the physical relationship between two time series, cross-wavelet spectra (XWS) and squared wavelet coherence (SWC) were analyzed. For the two WPSs, XWS exposes areas with common power and the phase relationship, and the SWC highlights phase-locked behavior within the area where XWS reveals high common power (Grinsted et al. 2004). Before performing these analyses, all input data were resampled by linear interpolation to 1-kyr resolution, linearly detrended, and normalized to zero mean and unit variance.
Results
Paleomagnetic results
Representative AF demagnetizations are presented in a vector diagram (Fig. 2). After removal of an unstable viscous component at AF steps of 5 or 10 mT, the samples reveal a stable component converging toward the origin up to an AF of 40–70 mT. Compared with the samples that reveal positive inclinations, the stable component in the samples of negative inclinations is maintained up to a lower AF step of 40 or 50 mT. As the demagnetizations display the stable component commonly from 10 to 40 mT, where the remanence intensities account for ~ 48–89% of the total NRM, a PCA method was applied to six consecutive AF data points of each sample to isolate the ChRM.

Representative results of stepwise alternating field (AF) demagnetization on vector diagrams. Solid (open) squares are projections of vector end points onto the horizontal (vertical) plane. The core was not azimuthally oriented
Paleomagnetic results are presented in Fig. 3 and include down-core variations in NRM intensity at each demagnetization step, in the declination and inclination of ChRMs, and in MAD values. The initial NRM intensities vary within a range of ~ 1–19 mA/m and are largely demagnetized in fields of 90 mT, with ~ 20% of the initial NRM remaining. The MAD values are < 5° for ~ 99.8% of the samples, indicating well-defined ChRMs, and only six samples have MAD values of > 5° at depth intervals with low NRM intensity around polarity transitions (Fig. 3d). The declination and inclination of the ChRM show magnetic polarity transitions at depths of ~ 578 cm and ~ 677 cm (Fig. 3b, c). As the studied core shows continuous sedimentary facies without hiatus, the two polarity transitions were assigned to the Matuyama–Brunhes (M–B) and upper Jaramillo boundaries, respectively. The mean inclination value was calculated using an inclination-only statistic (Arason and Levi 2010) to avoid a shallowing bias of the simple arithmetic mean inclination and yielded 48.4° (α95= 1.4°) for the Brunhes Chron and − 40.9° (α95 = 4.2°) during the Matuyama Chron (~ 578–677 cm depth; above the upper Jaramillo transition). The mean inclination for the Brunhes Chron is similar to the expected inclination (51°) from the geocentric axial dipole field, and systematic inclination shallowing is not observed (Fig. 3c). All of the paleomagnetic data are provided in Additional file 2: Table S1.

Down-core variations in a natural remanent magnetization (NRM) intensity at each AF demagnetization step, b declination and c inclination of characteristic remanent magnetization (ChRM) directions, and d maximum angular deviation (MAD). The reference magnetic polarity is indicated on the right side of the figure
Rock magnetic properties
Values of S300 are in the range of 0.93–0.96, with a mean of 0.94. Relatively low Bcr values of 31–47 mT with a mean of 40 mT and narrow widths of hysteresis loops (Bc of < 21 mT) are observed in the selected samples. Such high S300 values near 1.0 with low Bcr values indicate a predominance of low-coercivity ferrimagnetic minerals (Thompson and Oldfield 1986) throughout the core.
To decipher the domain state (i.e., grain size) of ferrimagnetic minerals, hysteresis parameters are presented on a biplot of Bcr/Bc and Mrs/Ms (Day plot; Day et al. 1977) in Fig. 4a (depths of the selected samples are marked as open diamonds in Fig. 5). According to the conventional standards for domain state sectors of single-domain (SD), pseudo-SD (PSD), and multi-domain (MD), all data fall within the PSD range and far from the MD region. With respect to the mixing models of superparamagnetic (SP)–SD and SD–MD (gray lines in Fig. 4a; Dunlop 2002), our data lie closer to the SP–SD mixing line. This result implies a low contribution of a coarse MD fraction. Representative FORC diagrams (Fig. 4b) further identify the domain state of ferrimagnetic minerals. Typically, a narrow central ridge feature along the Bc axis identifies non-interacting SD magnetite of magnetofossils (Egli et al. 2010; Roberts et al. 2014). The vertical spread of the FORC distribution, forming triangular-shaped contours, indicates a significant contribution of PSD magnetite of detrital origin (Roberts et al. 2014). In addition, the distribution in the lower-left negative FORC region, which is an inherent SD behavior (Newell 2005), as well as only slight divergence of contours at low coercivity confirms a small contribution of coarse MD particles. At the same mass-normalized intensity scale, the relative concentration of biogenic magnetite differs markedly between the two samples (Fig. 4b), showing a sharp central ridge with higher peak intensity in the lower panel. Although such relative contributions vary with depth, overall results of the Day and FORC diagrams identify a mixture of biogenic SD and detrital PSD magnetite as the dominant magnetic carrier.

a Plot of hysteresis ratios (Day plot; Day et al. 1977) and b representative examples of first-order reversal curve (FORC) diagrams. In the Day plot, the single-domain (SD), multi-domain (MD), and superparamagnetic (SP) mixing curves of Dunlop (2002) are shown in gray. Bcr, remanent coercivity; Bc, coercive force; Mr, saturation remanent magnetization; Ms, saturation magnetization. FORC diagrams are plotted as Bc versus interaction field (Bu)

Down-core variations in rock magnetic parameters. a S-ratio (S300), b magnetic susceptibility (χ), c susceptibility of anhysteretic remanent magnetization (χARM), d isothermal remanent magnetization acquired in a DC field of 1 T (IRM1T), and e grain-size parameters (χARM/χ and χARM/IRM1T). Selected depths for the hysteresis measurements are marked as open diamonds on the right of the plot
Concentration-related magnetic parameters show cyclic fluctuations in depth from a few decimeters to a meter with value ranges of less than a factor of 3: χ = ~ 0.1–0.2 × 10⁻⁶m3/kg, χARM = ~ 2.0–4.5 × 10⁻⁶m3/kg, and IRM1T = ~ 2–4 × 10⁻³Am2/kg (Fig. 5b–d). Of the parameters, χARM in a sediment core is sensitively acquired by SD magnetite with a weak magnetostatic interaction, such as biogenic magnetite, whereas values of χ and IRM1T are related to the total quantity of all magnetic minerals, with a negligible grain-size effect (Thompson and Oldfield 1986). Therefore, the ratios of χARM to IRM1T and χARM to χ, which are conventional grain-size proxies, are commonly considered as representing the relative contributions of finer biogenic magnetite and coarser detrital magnetic minerals in marine sediments (e.g., Yamazaki 2009; Yamazaki and Ikehara 2012). χARM/IRM1T and χARM/χ show similar variation, with amplitudes smaller than twofold. Above a depth of ~ 400 cm, their amplitudes show similar peaks and troughs to χARM (Fig. 5c, e), indicating that grain-size parameters (χARM/χ and χARM/IRM1T) in this study are strongly linked to quantitative variation in the concentration of finer SD magnetite rather than of coarser magnetic minerals. As identified in FORC analysis, the most distinctive feature in the diagrams is that the biogenic SD magnetite signal is enhanced as the central peak (Fig. 4b) in the sample showing higher χARM (338.5 cm depth) in comparison with the sample showing lower χARM sample (227.5 cm depth). Therefore, it is reasonable to infer that temporal variations in χARM/χ and χARM/IRM1T reflect a relative fluctuation of biogenic SD magnetite, at least above a depth of ~ 400 cm. From the perspective of RPI estimation, the variation in bulk magnetic properties of less than a factor of 2–3 throughout the core represents stable concentrations and grain sizes of NRM-carrying grains, namely SD–PSD magnetites, which fulfills the conventional criteria of Tauxe (1993).
Relative paleointensity proxies
To estimate RPI proxies, NRM was normalized by laboratory-induced magnetizations (χ, χARM, and IRM1T) after demagnetization at an AF of 10 mT and then represented as NRM10mT/χ, NRM10mT/ARM10mT, and NRM10mT/IRM10mT, respectively (Fig. 6). The RPI proxies show consistent overall patterns, although some differences in amplitude are observed through certain depth intervals (e.g., the Matuyama Chron). Such agreement between the multiple normalizations is generally regarded indicating that the RPI estimates passed the reliability test (Tauxe 1993). However, a single demagnetization step in calculating RPI can bias the influence of high-coercivity components (Valet and Meynadier 1998), and the choice of optimal normalizer is also an issue for RPI estimation. For example, χ can be considered as a less effective normalizer owing to possible activation of non-ferrimagnetic minerals and large magnetite grains that do not carry NRM.

Relative paleointensity proxies for NPGP1401-2A. Correlation coefficient (r) values for the slope of RPIARM (= NRM10–40mT/ARM10–40mT) and RPIIRM (= NRM10–40mT/IRM10–40mT) are displayed at the top of the panel as red dots and blue dots, respectively
RPI proxies were also calculated using the slope method of Tauxe et al. (1995). The RPI slopes were determined from NRM lost versus ARM lost (or IRM lost) at 10–40 mT demagnetization steps where stable ChRM directions remain (NRM10–40mT/ARM10–40mT and NRM10–40mT/IRM10–40mT; Fig. 6), and are presented as RPIARM and RPIIRM, respectively, for convenience. The linear correlation coefficient (r) was calculated to monitor the quality of the slope fit (Fig. 6), following Channell et al. (2002). The r values are generally close to 1 (> 0.95), although some specific intervals show a drop in r value around the polarity transitions corresponding to intervals of high MAD values (Fig. 3). For the whole core, the mean r values are higher than 0.99 (0.9932 and 0.9928 for RPIARM and RPIIRM, respectively), indicating that both ARM and IRM have similar coercivity spectra with NRM and can thus be used as appropriate normalizers in RPI estimation.
Age control
The two polarity changes at ~ 578 cm and ~ 677 cm in NPGP1401-2A provide an age framework as the M–B boundary of ~ 785–772 ka (e.g., Channell et al. 2010; Sagnotti et al. 2016; Mark et al. 2017; Valet et al. 2019) and the upper Jaramillo boundary of ~ 991–990 ka (Gradstein et al. 2012; Simon et al. 2018), respectively. In a sequence with such a low sedimentation rate (~ 677/990 cm/ka), surficial mixing and post-depositional remanent magnetization (pDRM) lock-in effects could affect the paleomagnetic age delay (e.g., Suganuma et al. 2010; Simon et al. 2016, 2018). Thus, an age model independent to paleomagnetic records was generated by correlating climate-related variations from geochemical and rock magnetic proxies (Fig. 7).

Age model for NPGP1401-2A. a ARM/IRM of a reference core KR0310-PC1 (Yamazaki and Kanamatsu 2007) is correlated to b χARM/IRM1T and χARM/χ of NPGP1401-2A for the older part (> ~ 700 ka). For the younger part, c Ba/Ti of NPGP1401-2A is correlated to d that of core SO202-39-3 (Korff et al. 2016) and e Ba/Al of ODP 882 (Jaccard et al. 2010). Temporal variations in f the SINT-2000 RPI stack (Valet et al. 2005) and g our RPI proxies (RPIARM and RPIIRM) are shown, and normal polarity chrons for NPGP1401-2A are marked as gray shades. h Linear sedimentation rate (LSR) calculated for the assigned age–depth points
Our magnetic grain-size proxies (χARM/IRM1T and χARM/χ) show distinctive cyclic fluctuations throughout the core (Fig. 7b) that are similar to the fluctuations in ARM/IRM of a nearby core, KR0310-PC1 (Fig. 7a; Yamazaki and Kanamatsu 2007). For sediments older than ~ 700 ka, relatively sharp glacial lows or interglacial highs are correlated despite the smoothed variations of our grain-size proxies (Fig. 7a, b). For the < ~700 ka record, the uncertainty of age correlations was overcome by correlating Ba/Ti (Ba/Al) records to reference cores SO202-39-3 (Korff et al. 2016) and ODP 145-882 (Jaccard et al. 2010) with a mean age window of ~ 50 kyr for correlations (Fig. 7c–e). In the North Pacific, Ba/Ti or Ba/Al records corresponding to productivity changes are closely connected to paleoclimatic variations (Jaccard 2005; Jaccard et al. 2010) and are useful for establishing an age model (e.g., Korff et al. 2016; Shin et al. 2018). Within the Ba/Ti age framework, magnetic grain-size proxies between two adjacent cores also have temporally similar fluctuations (Fig. 7a, b). Consequently, a total of 25 tie points was assigned, and the age of the bottom of the core was estimated to ~ 1.07 Ma. With linear interpolation between tie points, the sedimentation rate was calculated as varying from ~ 0.2 to ~ 1.4 cm/kyr with a mean of ~ 0.7 cm/kyr (Fig. 7h). Age uncertainties of the reference records and our correlations are expected to be within ~ 20 kyr.
In the age model, RPI proxies show overall temporal variations consistent with a global stack record such as SINT-2000 (Fig. 7f, g). However, the delayed age of the M–B boundary (~ 794 ka) is probably caused by surficial mixing and pDRM lock-in delay accompanied by a lower sedimentation rate (~ 0.4 cm/kyr during ~ 900–750 ka; Fig. 7h). Considering the recently determined Be-proxy age constraints on the M–B boundary (~ 772 ka at mid-reversal: Simon et al. 2018 and Valet et al. 2019), the age delay of ~ 22 ka may indicate lock-in depths of ~ 8 cm below the mixing layer for the M–B boundary in the studied core.
Discussion
Orbital cycles and possible climatic contamination of RPI estimates
Orbital frequencies in RPI records involve some sources of uncertainty, such as sediment ages and resolutions. In this study, low data resolution (i.e., averaging ~ 3 kyr over a sample) and related age uncertainties may obscure the potential signals of short-term orbital forcing such as obliquity (~ 41 kyr) and precession (~ 23 kyr) in the RPI record. In particular, the highly smoothed RPI signals and pDRM lock-in delay for our > ~ 700 ka record can produce noisy signals at both orbital and non-orbital frequencies. However, our RPI proxies for < ~ 700 ka share generally similar peaks/troughs with SINT-2000 at a scale of ~ 10–30 kyr (Fig. 7f, g), suggesting a good age control and detectability of longer orbital parameters such as eccentricity (~ 100 kyr). For example, an orbital cycle with a ~ 100-kyr period has been consistently reported in low-resolution North Pacific RPI records from power spectral analysis (e.g., Yamazaki 1999; Yamazaki and Kanamatsu 2007), although its temporal continuity and possible climatic/lithological contamination were not analyzed. Therefore, we applied wavelet analysis to detect the potential orbital frequencies in our RPI proxies and to test for the presence of coherence with lithological factors.
WPS of RPI proxies using the slope method (RPIARM and RPIIRM) show significant orbital periods of 100 kyr and 41 kyr over a limited time interval (Fig. 8a, b, respectively). In WPS contour maps for both RPIARM and RPIIRM, the 100-kyr period emerges significantly during 900–700 ka and some older time intervals close to the cone of influence (shaded areas near the edge effects in Fig. 8). The 41-kyr period is also sporadically significant during 400–200 ka and at around 700 ka (Fig. 8a, b). The random distribution of orbital power at < ~ 20 kyr is probably attributed to a noise signal caused by low sedimentation rate. A prominent difference between RPIARM and RPIIRM is the presence of the 100-kyr orbital period in the WPS of RPIARM during 400–200 ka (Fig. 8a). As persistent orbital cycles were not detected in the wavelet spectra of our RPI proxies, even at a 100-kyr period, the intermittent occurrence of orbital periods is likely lithological or climatic contamination of RPI rather than a geomagnetic origin (e.g., Xuan and Channell 2008). The WPS of NRM also reveal orbital periods of 100 kyr and 41 kyr at similar time intervals to those given above (Fig. 8c), which derive from the lithology of magnetic carriers controlled by environmental/climatic factors as well as geomagnetic field intensity (Tauxe 1993). Thus, the similar distribution of orbital frequencies between RPIs and NRM confirms relict orbital contamination of the normalized intensity, incompletely normalized from the NRM records.

Results of a–c wavelet power spectra (WPS), d–e cross-wavelet spectra (XWS), and f–j squared wavelet coherence (SWC). NRM10mT, ARM10mT, and IRM10mT are the remanences demagnetized in a 10 mT AF field. The 100-kyr, 41-kyr, and 23-kyr orbital periods are marked as horizontal white dashed lines. The black contour represents the 95% significance level, and the lighter shade indicates the cone of influence where the wavelet spectra may be distorted by edge effects. Arrows in diagrams represent the relative phasing of two time series: right-pointing, left-pointing, and non-horizontal arrows indicate in-phase, anti-phase, and out of phase, respectively
Magnetic parameters used for the normalizer (ARM and IRM after demagnetization at 10 mT steps) were tested for their possible link with the orbital contamination of RPI proxies. For the time interval 900–700 ka, XWS maps between RPI and the corresponding normalizers (Fig. 8d, e) show significant common power at the 100-kyr orbital period, but their phase arrows (phase relationships) are variable. In the SWC maps of Fig. 8h, i, a significant physical relationship between RPIs and normalizers is not found for the time interval 900–700 ka. Therefore, orbital contamination of the 100-kyr period for RPI during the time interval 900–700 ka (Fig. 8a, b) is not directly induced by the normalizers.
Interestingly, RPIARM has spectral coherence at the 100-kyr period with the ARM record during 400–200 ka, showing high common power and a consistent anti-phase relationship (negative correlation) in XWS and SWC maps (left-pointing arrows in Fig. 8d, h). Such significant wavelet coherence with the anti-phase relationship would indicate inefficient normalization and overcompensation when ARM is used as a normalizer. Previously, spectral coherence between RPI and its normalizer ARM at the 100-kyr period has been suggested to be an effect of the magnetostatic interaction between detrital SD magnetites hampering ARM acquisition (Yamazaki and Kanamatsu 2007; Yamazaki 2008), but our FORC diagrams (Fig. 4b) confirm an intrinsic signature of PSD detrital magnetite with the intraparticle interaction (Roberts et al. 2013). In a mixture of non-interacting biogenic magnetite and detrital magnetite, relative changes in the two different origins could affect ARM normalization in RPI estimation in terms of different coercivity distribution and remanence acquisition efficiency (Ouyang et al. 2014). In the present study, ARM shows a prominent cyclicity of the 100-kyr period at < 800–700 ka (Additional file 1: Figure S1a), reflecting glacial–interglacial cyclicity of fine magnetite concentration after the mid-Pleistocene transition. In contrast, ARM/IRM (calculated using ARM and IRM demagnetized at 10 mT) shows the most prominent 100-kyr cycles at around 400–200 ka and also has a consistent anti-phase relationship with RPIARM (Additional file 1: Figure S1b–d). Such consistency suggests that enhanced cyclic fluctuations of biogenic magnetite over detrital components result in overcompensation of RPI using ARM normalization.
As IRM does not show coherence with RPIIRM (Fig. 8e, i), IRM was considered as the more suitable normalizer and for which wavelet coherence of RPIIRM with grain-size variation was additionally tested (Fig. 8f, j). The SWC maps show little coherence and variable phase relationships at orbital periods, indicating that the 41-kyr and 100-kyr orbital contamination of RPIIRM is not directly induced by the grain-size proxies. We speculatively regard the intermittent presence of orbital periods in RPIIRM as climatic contamination prompted by non-magnetic factors. In addition, smoothed RPI signals due to low resolution and the lock-in effect could be responsible for the significant orbital contamination during 900–700 ka. It is also noted that the coexistence of 41-kyr and 100-kyr orbital periods at ~ 700 ka in the WPS of RPI proxies and NRM (Fig. 8a–c) might reflect climatic contamination linked to the mid-Pleistocene climate transition when dominant orbital power shifted from 41 kyr to 100 kyr.
Global consistency of RPI estimates
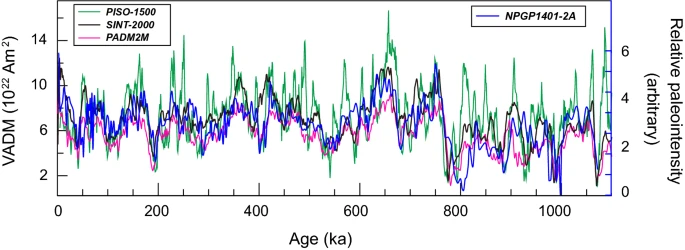
The final RPI record of NPGP1401-2A (RPIIRM) was compared with the three global models (SINT-2000, PISO-1500, and PADM2M) (Fig. 9a) and with local RPI records reported near the study area (NGC69 and NGC65: Yamazaki 1999; KR0310-PC1: Yamazaki and Kanamatsu 2007) (Fig. 9b). Our RPI obtained from studied core NPGP1401-2A is generally consistent well with the other local records (Fig. 9b). All of the local records display comparatively low paleointensity during the late Matuyama, except for KR0310-PC1, although our RPI record has lower resolution for > ~700 ka. Weak geomagnetic field strength during the Matuyama is also prominent in SINT-2000 and PADM2M, whereas PISO-1500 displays similar mean field intensity between the Brunhes and Matuyama chrons (Fig. 9a).

Comparison between global RPI stacks (upper) and local RPI records from the North Pacific (lower). The global stacks are PISO-1500 (dark blue), SINT-2000 (black) of Valet et al. (2005), and PADM2M (magenta) of Ziegler et al. (2011). The local records are NGC65 (orange) and NGC69 (green) of Yamazaki (1999) and KR0310-PC1 (red) of Yamazaki and Kanamatsu (2007). The record of the studied core NPGP1401-2A is shown in blue
Overall, the RPI record estimated from NPGP1401-2A is highly consistent with the millennial-scale pattern of variation seen in the global records (Fig. 9), indicating a well-defined paleointensity record for the last ~ 1.1 Myr. Although our RPI record is not free of orbital contamination during certain time intervals (Fig. 8b), its high level of consistency with the global stacks suggests that the dipolar origin of the geomagnetic field was not receded in the RPI signals. Our well-determined RPI estimates also represent an improvement in the North Pacific records, in particular during the Brunhes Chron (Fig. 9 and Additional file 3: Table S2).
Conclusion
Paleomagnetic and rock magnetic analyses for deep-sea sediments in the North Pacific were performed to obtain a reliable RPI record. Down-core variation in inclination and declination revealed two polarity reversals, correlating to the Matuyama–Brunhes and upper Jaramillo transitions. Magnetic signals were carried dominantly by a mixture of biogenic SD magnetite and detrital PSD magnetite, with bulk concentration and grain size varying by less than a factor of 3. The RPI proxies calculated by ARM and IRM normalization, using a slope method, appear to be well defined, as judged by NRM and normalizers having almost the same coercivity spectra (r values of > 0.99). The age of the bottom sediments of the studied core was determined as ~ 1.07 Ma based on the correlation of our RPI proxies to a global stack. Further wavelet analysis revealed the intermittent presence of ~ 100-kyr and ~ 41-kyr orbital periods in the RPI proxies. In particular, RPIARM shows a significant coherence and anti-phase relationship with the normalizer during 400–200 ka, indicating an over-normalization of ARM. The presence of the 100-kyr orbital period in ARM/IRM is also prominent showing a coherency with RPIARM in the same time interval, suggesting that a differing ability in remanence acquisition between biogenic and detrital magnetite is probably reflected as contamination. In contrast, a coherence test for RPIIRM shows no physical link between orbital periods and magnetic parameters related to the concentration and grain size of magnetic minerals, indicating negligible lithological contamination. Although RPIIRM is not fully free from an amount of orbital contamination, likely caused by climate changes, its high level of consistency with global stacks indicates a dipolar signal.
Abbreviations
- AF:
-
alternating field
- VSM:
-
vibrating sample magnetometer
- ARM:
-
anhysteretic remanent magnetization
- ARM10mT :
-
ARM demagnetized at AF of 10 mT
- B c :
-
coercive force
- B cr :
-
remanent coercive force
- χ :
-
mass-normalized magnetic susceptibility
- χ ARM :
-
mass-normalized ARM susceptibility
- ChRM:
-
characteristic remanent magnetization
- DC:
-
direct current
- FORC:
-
first-order reversal curve
- IRM:
-
isothermal remanent magnetization
- IRM1T :
-
IRM saturated by DC field of 1 T
- IRM10mT :
-
IRM demagnetized at AF of 10 mT
- MAD:
-
maximum angular deviation
- M–B:
-
Matuyama–Brunhes
- MD:
-
multi-domain
- Mrs :
-
saturation remanent magnetization
- Ms :
-
saturation magnetization
- NRM:
-
natural remanent magnetization
- PCA:
-
principal component analysis
- PSD:
-
pseudo-single domain
- RPI:
-
relative paleointensity
- RPIARM :
-
RPI proxy normalized by ARM
- RPIIRM :
-
RPI proxy normalized by IRM
- SD:
-
single-domain
- SP:
-
superparamagnetic
- WPS:
-
(local) wavelet power spectra
- SWC:
-
squared wavelet coherence
- XRF:
-
X-ray fluorescence
- XWS:
-
cross-wavelet spectra
References
Arason P, Levi S (2010) Maximum likelihood solution for inclination-only data in paleomagnetism. Geophys J Int 182:753–771. https://doi.org/10.1111/j.1365-246X.2010.04671.x
Bloemendal J, King JW, Hall FR, Doh S-J (1992) Rock magnetism of Late Neogene and Pleistocene deep-sea sediments: relationship to sediment source, diagenetic processes, and sediment lithology. J Geophys Res 97:4361. https://doi.org/10.1029/91JB03068
Channell JET, Mazaud A, Sullivan P, Turner S, Raymo ME (2002) Geomagnetic excursions and paleointensities in the Matuyama Chron at Ocean Drilling Program Sites 983 and 984 (Iceland Basin). J Geophys Res 107:2114. https://doi.org/10.1029/2001JB000491
Channell JET, Xuan C, Hodell DA (2009) Stacking paleointensity and oxygen isotope data for the last 1.5 Myr (PISO-1500). Earth Planet Sci Lett 283:14–23. https://doi.org/10.1016/j.epsl.2009.03.012
Channell JET, Hodell DA, Singer BS, Xuan C (2010) Reconciling astrochronological and 40Ar/39Ar ages for the Matuyama–Brunhes boundary and late Matuyama Chron. Geochem Geophys Geosyst 11:Q0AA12. https://doi.org/10.1029/2010gc003203
Channell JET, Wright JD, Mazaud A, Stoner JS (2014) Age through tandem correlation of Quaternary relative paleointensity (RPI) and oxygen isotope data at IODP Site U1306 (Eirik Drift, SW Greenland). Quat Sci Rev 88:135–146. https://doi.org/10.1016/j.quascirev.2014.01.022
Day R, Fuller M, Schmidt VA (1977) Hysteresis properties of titanomagnetites: grain-size and compositional dependence. Phys Earth Planet Inter 13:260–267. https://doi.org/10.1016/0031-9201(77)90108-X
Dunlop DJ (2002) Theory and application of the Day plot (Mrs/Ms versus Hcr/Hc) 1. Theoretical curves and tests using titanomagnetite data. J Geophys Res 107:2056. https://doi.org/10.1029/2001jb000486
Egli R (2013) VARIFORC: an optimized protocol for calculating non-regular first-order reversal curve (FORC) diagrams. Glob Planet Change 110:302–320. https://doi.org/10.1016/j.gloplacha.2013.08.003
Egli R, Chen AP, Winklhofer M, Kodama KP, Horng C-S (2010) Detection of noninteracting single domain particles using first-order reversal curve diagrams. Geochem Geophys Geosyst 11:Q01Z11. https://doi.org/10.1029/2009gc002916
Fuller M (2006) Geomagnetic field intensity, excursions, reversals and the 41,000-yr obliquity signal. Earth Planet Sci Lett 245:605–615. https://doi.org/10.1016/j.epsl.2006.03.022
Gradstein FM, Ogg JG, Schmitz MD, Ogg GM (2012) The geologic time scale. Elsevier, Amsterdam
Grinsted A, Moore JC, Jevrejeva S (2004) Application of the cross wavelet transform and wavelet coherence to geophysical time series. Nonlinear Process Geophys 11:561–566. https://doi.org/10.5194/npg-11-561-2004
Guyodo Y, Valet J-P (1999) Global changes in intensity of the Earth’s magnetic field during the past 800 kyr. Nature 399:249–252. https://doi.org/10.1038/20420
Guyodo Y, Gaillot P, Channell JET (2000) Wavelet analysis of relative geomagnetic paleointensity at ODP Site 983. Earth Planet Sci Lett 184:109–123. https://doi.org/10.1016/S0012-821X(00)00313-7
Harrison RJ, Feinberg JM (2008) FORCinel: an improved algorithm for calculating first-order reversal curve distributions using locally weighted regression smoothing. Geochem Geophys Geosyst 9:Q05016. https://doi.org/10.1029/2008GC001987
Heslop D (2007) A wavelet investigation of possible orbital influences on past geomagnetic field intensity. Geochem Geophys Geosyst 8:Q03003. https://doi.org/10.1029/2006GC001498
Jaccard SL (2005) Glacial/interglacial changes in subarctic North Pacific stratification. Science 308:1003–1006. https://doi.org/10.1126/science.1108696
Jaccard SL, Galbraith ED, Sigman DM, Haug GH (2010) A pervasive link between Antarctic ice core and subarctic Pacific sediment records over the past 800 kyrs. Quat Sci Rev 29:206–212. https://doi.org/10.1016/j.quascirev.2009.10.007
Kent DV, Opdyke ND (1977) Palaeomagnetic field intensity variation recorded in a Brunhes epoch deep-sea sediment core. Nature 266:156–159. https://doi.org/10.1038/266156a0
Kirschvink JL (1980) The least-squares line and plane and the analysis of palaeomagnetic data. Geophys J Int 62:699–718. https://doi.org/10.1111/j.1365-246X.1980.tb02601.x
Korff L, von Dobeneck T, Frederichs T, Kasten S, Kuhn G, Gersonde R, Diekmann B (2016) Cyclic magnetite dissolution in Pleistocene sediments of the abyssal northwest Pacific Ocean: evidence for glacial oxygen depletion and carbon trapping. Paleoceanography 31:600–624. https://doi.org/10.1002/2015PA002882
Laj C, Kissel C, Mazaud A, Channell JET, Beer J (2000) North Atlantic palaeointensity stack since 75 ka (NAPIS-75) and the duration of the Laschamp event. Philos Trans R Soc A Math Phys Eng Sci. https://doi.org/10.1098/rsta.2000.0571
Lurcock PC, Wilson GS (2012) PuffinPlot: a versatile, user-friendly program for paleomagnetic analysis. Geochem Geophys Geosyst 13:Q06Z45. https://doi.org/10.1029/2012gc004098
Mark DF, Renne PR, Dymock RC, Smith VC, Simon JI, Morgan LE, Staff RA, Ellis BS, Pearce NJG (2017) High-precision 40 Ar/39 Ar dating of pleistocene tuffs and temporal anchoring of the Matuyama–Brunhes boundary. Quat Geochronol 39:1–23. https://doi.org/10.1016/j.quageo.2017.01.002
Newell AJ (2005) A high-precision model of first-order reversal curve (FORC) functions for single-domain ferromagnets with uniaxial anisotropy. Geochem Geophys Geosyst 6:Q05010. https://doi.org/10.1029/2004GC000877
Ouyang T, Heslop D, Roberts AP, Tian C, Zhu Z, Qiu Y, Peng X (2014) Variable remanence acquisition efficiency in sediments containing biogenic and detrital magnetites: implications for relative paleointensity signal recording. Geochem Geophys Geosyst 15:2780–2796. https://doi.org/10.1002/2014GC005301
Roberts AP, Lehman B, Weeks RJ, Verosub KL, Laj C (1997) Relative paleointensity of the geomagnetic field over the last 200,000 years from ODP Sites 883 and 884, North Pacific Ocean. Earth Planet Sci Lett 152:11–23. https://doi.org/10.1016/S0012-821X(97)00132-5
Roberts AP, Tauxe L, Heslop D (2013) Magnetic paleointensity stratigraphy and high-resolution quaternary geochronology: successes and future challenges. Quat Sci Rev 61:1–16. https://doi.org/10.1016/j.quascirev.2012.10.036
Roberts AP, Heslop D, Zhao X, Pike CR (2014) Understanding fine magnetic particle systems through use of first-order reversal curve diagrams. Rev Geophys 52:557–602. https://doi.org/10.1002/2014RG000462
Sagnotti L, Giaccio B, Liddicoat JC, Nomade S, Renne PR, Scardia G, Sprain CJ (2016) How fast was the Matuyama–Brunhes geomagnetic reversal? A new subcentennial record from the Sulmona Basin, central Italy. Geophys J Int 204:798–812. https://doi.org/10.1093/gji/ggv486
Saracco G, Thouveny N, Bourlès DL, Carcaillet JT (2009) Extraction of non-continuous orbital frequencies from noisy insolation data and from palaeoproxy records of geomagnetic intensity using the phase of continuous wavelet transforms. Geophys J Int 176:767–781. https://doi.org/10.1111/j.1365-246X.2008.04057.x
Shin JY, Yu Y, Seo I, Hyeong K, Lim D, Kim W (2018) magnetic properties of deep-sea sediments from the North Pacific: a proxy of glacial deep-water ventilation. Geochem Geophys Geosyst 19:4433–4443. https://doi.org/10.1029/2018GC007735
Simon Q, Thouveny N, Bourlès DL, Valet J-P, Bassinot F, Ménabréaz L, Guillou V, Choy S, Beaufort L (2016) Authigenic 10Be/9Be ratio signatures of the cosmogenic nuclide production linked to geomagnetic dipole moment variation since the Brunhes/Matuyama boundary. J Geophys Res Solid Earth 121:7716–7741. https://doi.org/10.1002/2016JB013335
Simon Q, Bourlès DL, Thouveny N, Horng C-S, Valet J-P, Bassinot F, Choy S (2018) Cosmogenic signature of geomagnetic reversals and excursions from the Réunion event to the Matuyama–Brunhes transition (0.7–2.14 Ma interval). Earth Planet Sci Lett 482:510–524. https://doi.org/10.1016/j.epsl.2017.11.021
Suganuma Y, Yokoyama Y, Yamazaki T, Kawamura K, Horng CS, Matsuzaki H (2010) 10Be evidence for delayed acquisition of remanent magnetization in marine sediments: implication for a new age for the Matuyama–Brunhes boundary. Earth Planet Sci Lett 296:443–450. https://doi.org/10.1016/j.epsl.2010.05.031
Tauxe L (1993) Sedimentary records of relative paleointensity of the geomagnetic field: theory and practice. Rev Geophys 31:319. https://doi.org/10.1029/93RG01771
Tauxe L, Pick T, Kok YS (1995) Relative paleointensity in sediments: a Pseudo-Thellier approach. Geophys Res Lett 22:2885–2888. https://doi.org/10.1029/95GL03166
Tauxe L, Steindorf JL, Harris A (2006) Depositional remanent magnetization: toward an improved theoretical and experimental foundation. Earth Planet Sci Lett 244:515–529. https://doi.org/10.1016/j.epsl.2006.02.003
Thompson R, Oldfield F (1986) Environmental Magnetism. Springer, Dordrecht
Thouveny N, Bourlès DL, Saracco G, Carcaillet JT, Bassinot F (2008) Paleoclimatic context of geomagnetic dipole lows and excursions in the Brunhes, clue for an orbital influence on the geodynamo? Earth Planet Sci Lett 275:269–284. https://doi.org/10.1016/j.epsl.2008.08.020
Torrence C, Compo GP (1998) A practical guide to wavelet analysis. Bull Am Meteorol Soc 79:61–78. https://doi.org/10.1175/1520-0477(1998)079%3c0061:APGTWA%3e2.0.CO;2
Torrence C, Webster PJ (1999) Interdecadal changes in the ENSO–monsoon system. J Clim 12:2679–2690. https://doi.org/10.1175/1520-0442(1999)012%3c2679:ICITEM%3e2.0.CO;2
Tric E, Valet J-P, Tucholka P, Paterne M, Labeyrie L, Guichard F, Tauxe L, Fontugne M (1992) Paleointensity of the geomagnetic field during the last 80,000 years. J Geophys Res 97:9337. https://doi.org/10.1029/91JB01620
Valet J-P, Meynadier L (1998) A comparison of different techniques for relative paleointensity. Geophys Res Lett 25:89–92. https://doi.org/10.1029/97GL03489
Valet J-P, Meynadier L, Guyodo Y (2005) Geomagnetic dipole strength and reversal rate over the past two million years. Nature 435:802–805. https://doi.org/10.1038/nature03674
Valet J-P, Bassinot F, Simon Q, Savranskaia T, Thouveny N, Bourlés DL, Villedieu A (2019) Constraining the age of the last geomagnetic reversal from geochemical and magnetic analyses of Atlantic, Indian, and Pacific Ocean sediments. Earth Planet Sci Lett 506:323–331. https://doi.org/10.1016/j.epsl.2018.11.012
Xuan C, Channell JET (2008) Origin of orbital periods in the sedimentary relative paleointensity records. Phys Earth Planet Inter 169:140–151. https://doi.org/10.1016/j.pepi.2008.07.017
Yamazaki T (1999) Relative paleointensity of the geomagnetic field during Brunhes Chron recorded in North Pacific deep-sea sediment cores: orbital influence? Earth Planet Sci Lett 169:23–35. https://doi.org/10.1016/S0012-821X(99)00064-3
Yamazaki T (2008) Magnetostatic interactions in deep-sea sediments inferred from first-order reversal curve diagrams: implications for relative paleointensity normalization. Geochem Geophys Geosyst 9:Q02005. https://doi.org/10.1029/2007GC001797
Yamazaki T (2009) Environmental magnetism of Pleistocene sediments in the North Pacific and Ontong-Java Plateau: temporal variations of detrital and biogenic components. Geochem Geophys Geosyst 10(7):Q07Z04. https://doi.org/10.1029/2009gc002413
Yamazaki T, Ikehara M (2012) Origin of magnetic mineral concentration variation in the Southern Ocean. Paleoceanography 27:PA2206. https://doi.org/10.1029/2011pa002271
Yamazaki T, Kanamatsu T (2007) A relative paleointensity record of the geomagnetic field since 1.6 Ma from the North Pacific. Earth Planets Space 59:785–794. https://doi.org/10.1186/BF03352741
Yamazaki T, Oda H (2005) A geomagnetic paleointensity stack between 0.8 and 3.0 Ma from equatorial Pacific sediment cores. Geochem Geophys Geosyst 6:Q11H20. https://doi.org/10.1029/2005gc001001
Yokoyama Y, Yamazaki T (2000) Geomagnetic paleointensity variation with a 100 kyr quasi-period. Earth Planet Sci Lett 181:7–14. https://doi.org/10.1016/S0012-821X(00)00199-0
Yokoyama Y, Yamazaki T, Oda H (2007) Geomagnetic 100-ky variation extracted from paleointensity records of the equatorial and North Pacific sediments. Earth Planets Space 59:795–805. https://doi.org/10.1186/BF03352742
Ziegler LB, Constable CG, Johnson CL, Tauxe L (2011) PADM2M: a penalized maximum likelihood model of the 0–2 Ma palaeomagnetic axial dipole moment. Geophys J Int 184:1069–1089. https://doi.org/10.1111/j.1365-246X.2010.04905.x
Acknowledgements
The authors thank the editor Dr. Chuang Xuan for handling this paper. Valuable comments made by the editor and three anonymous reviewers greatly improved the paper. The paleomagnetic and rock magnetic measurements were made in KIGAM, Korea, by instrumental supports from Dr. Yoon Soo Lee. The XRF measurements were performed by Dr. Dhongil Lim at the Library of Marine Samples, KIOST.
Funding
This work was financially supported by the Ministry of Oceans and Fisheries (PM61151) and the Korea Institute of Ocean Science and Technology (PE99724 and PE99711).
Author information
Authors and Affiliations
Contributions
JYS carried out the sample preparation, data collection and analysis, and wrote the manuscript. YY contributed to the discussion. WK designed this work, sampled a study core, and supervised the paper preparation. All authors read and approved the final manuscript.
Corresponding author
Ethics declarations
Ethics approval and consent to participate
Not applicable.
Consent for publication
Not applicable.
Competing interests
The authors declare that they have no competing interests.
Additional information
Publisher's Note
Springer Nature remains neutral with regard to jurisdictional claims in published maps and institutional affiliations.
Additional files
Additional file 1: Figure S1.
(a) WPS of ARM10mT, (b) WPS of ARM/IRM10mT, (c) XWS between RPIARM and ARM/IRM10mT, and (d) SWC between RPIARM and ARM/IRM10mT.
Additional file 2: Table S1.
The paleomagnetic data of NPGP1401-2A.
Additional file 3: Table S2.
The relative paleointensity data of NPGP1401-2A.
Rights and permissions
Open Access This article is distributed under the terms of the Creative Commons Attribution 4.0 International License (http://creativecommons.org/licenses/by/4.0/), which permits unrestricted use, distribution, and reproduction in any medium, provided you give appropriate credit to the original author(s) and the source, provide a link to the Creative Commons license, and indicate if changes were made.
About this article

Cite this article
Shin, J.Y., Yu, Y. & Kim, W. Wavelet-based verification of a relative paleointensity record from the North Pacific. Earth Planets Space 71, 88 (2019). https://doi.org/10.1186/s40623-019-1067-x
Received:
Accepted:
Published:
DOI: https://doi.org/10.1186/s40623-019-1067-x